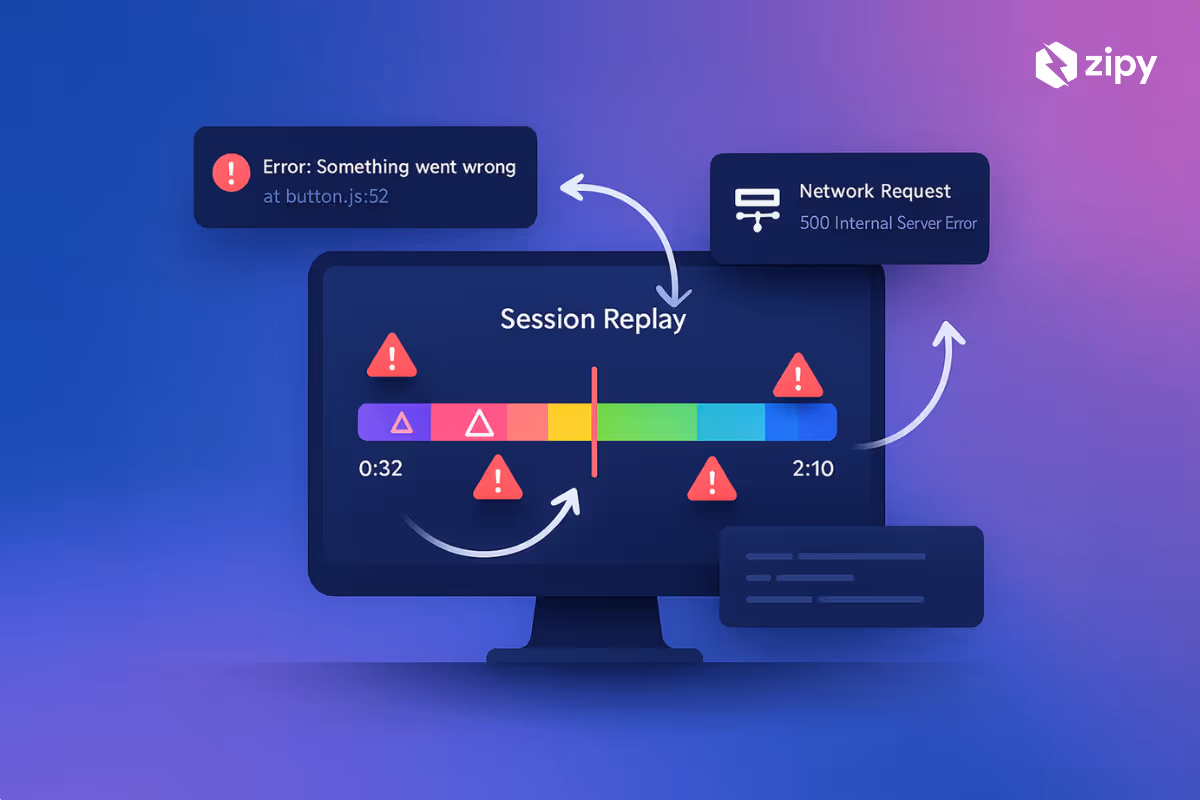
This guide shows you how to analyze session replay videos in Zipy to pinpoint frontend and backend issues fast. You’ll go from a long, noisy session list to a single actionable insight in under five minutes. Use this flow after an error spike, a user complaint, a failed QA step, or when a metric suddenly changes.
Prerequisites
A Zipy account and access to the relevant project
Permissions to view Session Replay, Console, Network, and Error data
Zipy SDK installed and initialized on your app (web or mobile) with session replay enabled
Source maps should be uploaded if you want readable stack traces
You know where to find Session Replay: left navigation > Session Replay
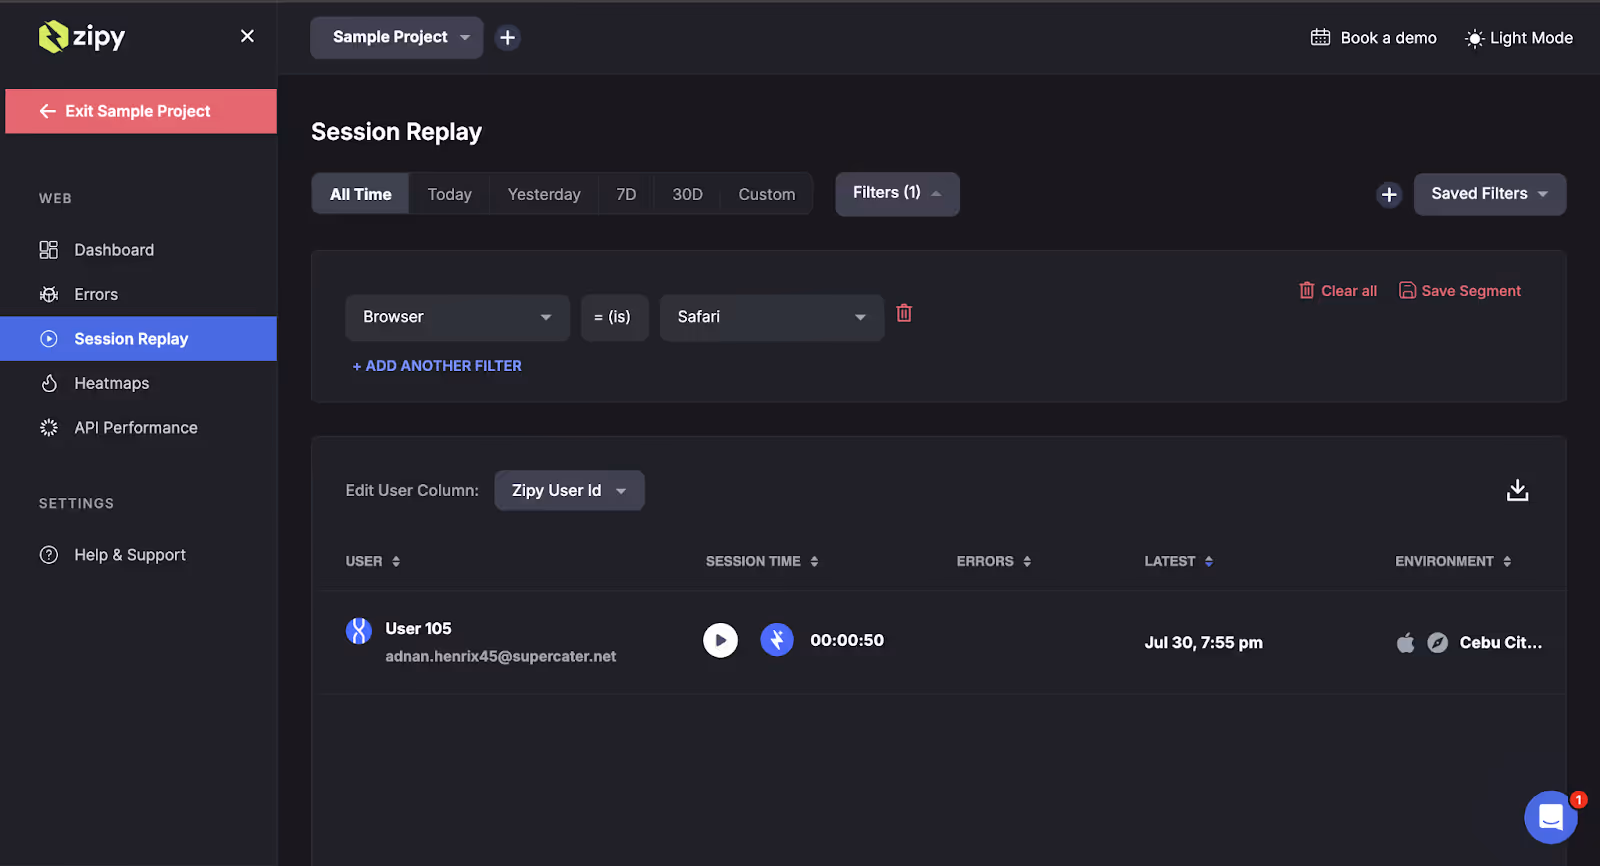
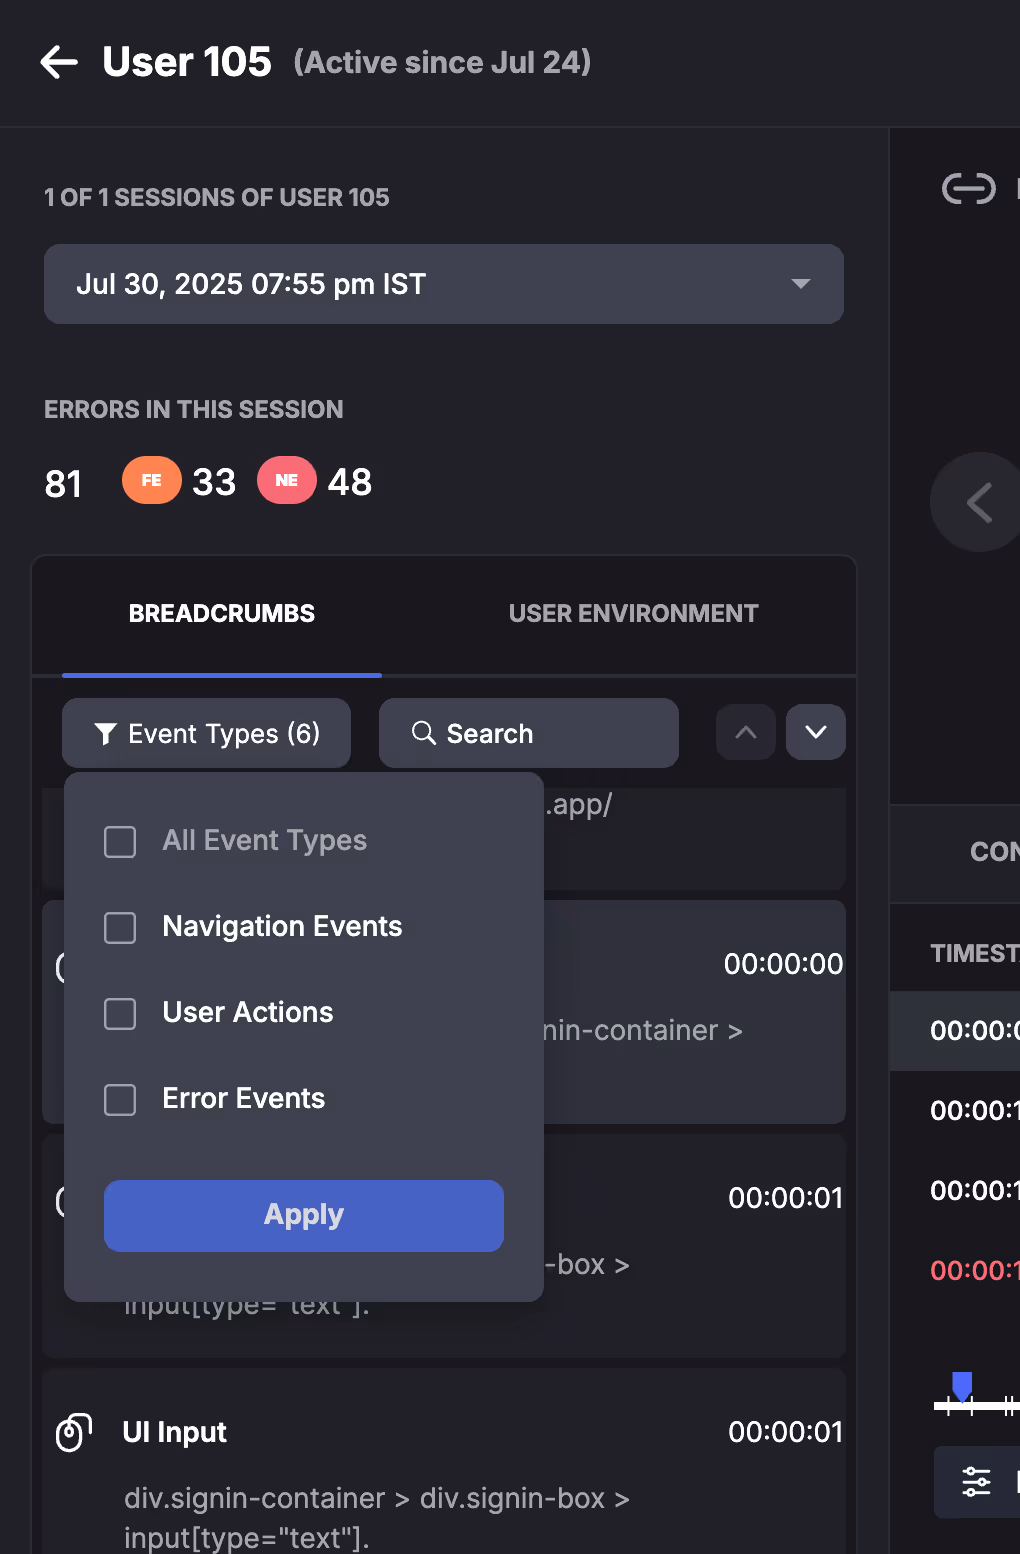
Step 1 - Narrow the session list to the right slice
Open Zipy, go to Session Replay from the left navigation. Set a time window (e.g., Today)
Apply quick filters: Has errors, 4xx/5xx network, URL contains, user email/ID, device, browser, or release version. Save the filter as a segment if you want to reuse it.
Decision: If debugging a backend spike you can filter for 5xx and slow requests similarly for UX issues you can filter frontend errors.
Expected outcome: You will have a list of 5 to 20 sessions, most likely to contain the issue you care about.
TIP: Start broad, then add filters gradually as over-filtering can hide useful edge cases.
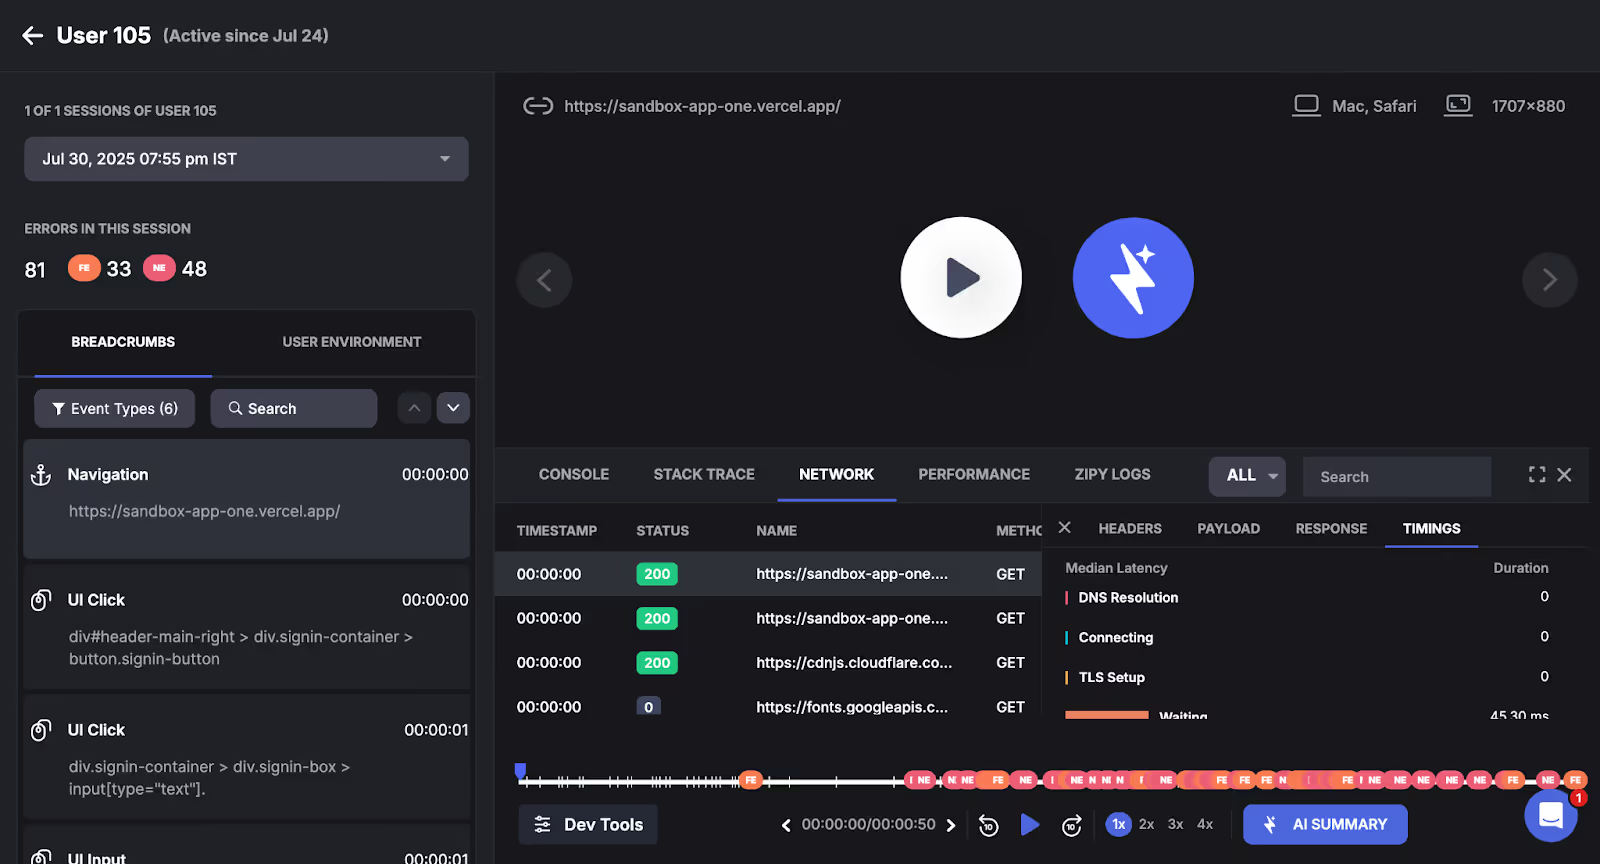
Step 2 - Skim the timeline to locate “hot zones.”
Open the required session and set playback speed upto 2x or 4 and check “Skip inactivity” to jump over inactivity.
Watch the timeline markers: errors, network failures, etc.
Decision: Identify clusters - e.g., error markers right after a route change or a network spike after a form submit.
Expected outcome: You must have got a 10 to 30 second window where the failure likely begins
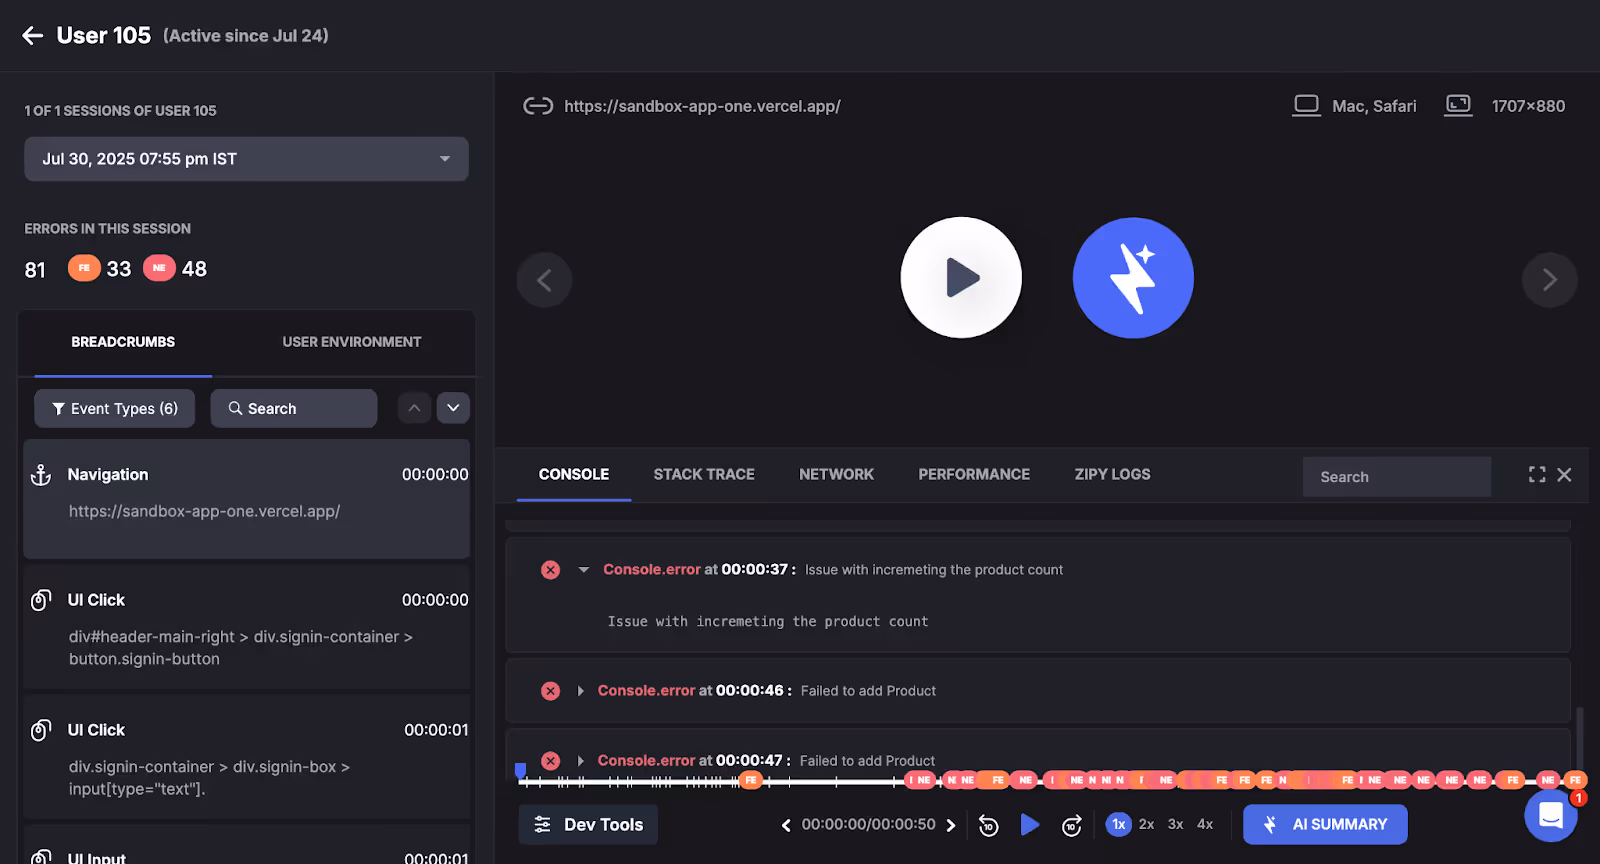
Step 3 - Inspect console logs along with session playback
Open the Console panel beside the player.
Expand stack traces and check source file/line (works best with source maps). Look for the first thrown error.
Decision: Is this a frontend exception (e.g., TypeError in a component) or a handled error surfaced to the UI? Pin the first cause.
Expected outcome: You will get to know a probable root component/module and the user action that triggers it.
TIP: Correlate the console timestamp with the exact click or route change on the timeline to separate cause from cascade.
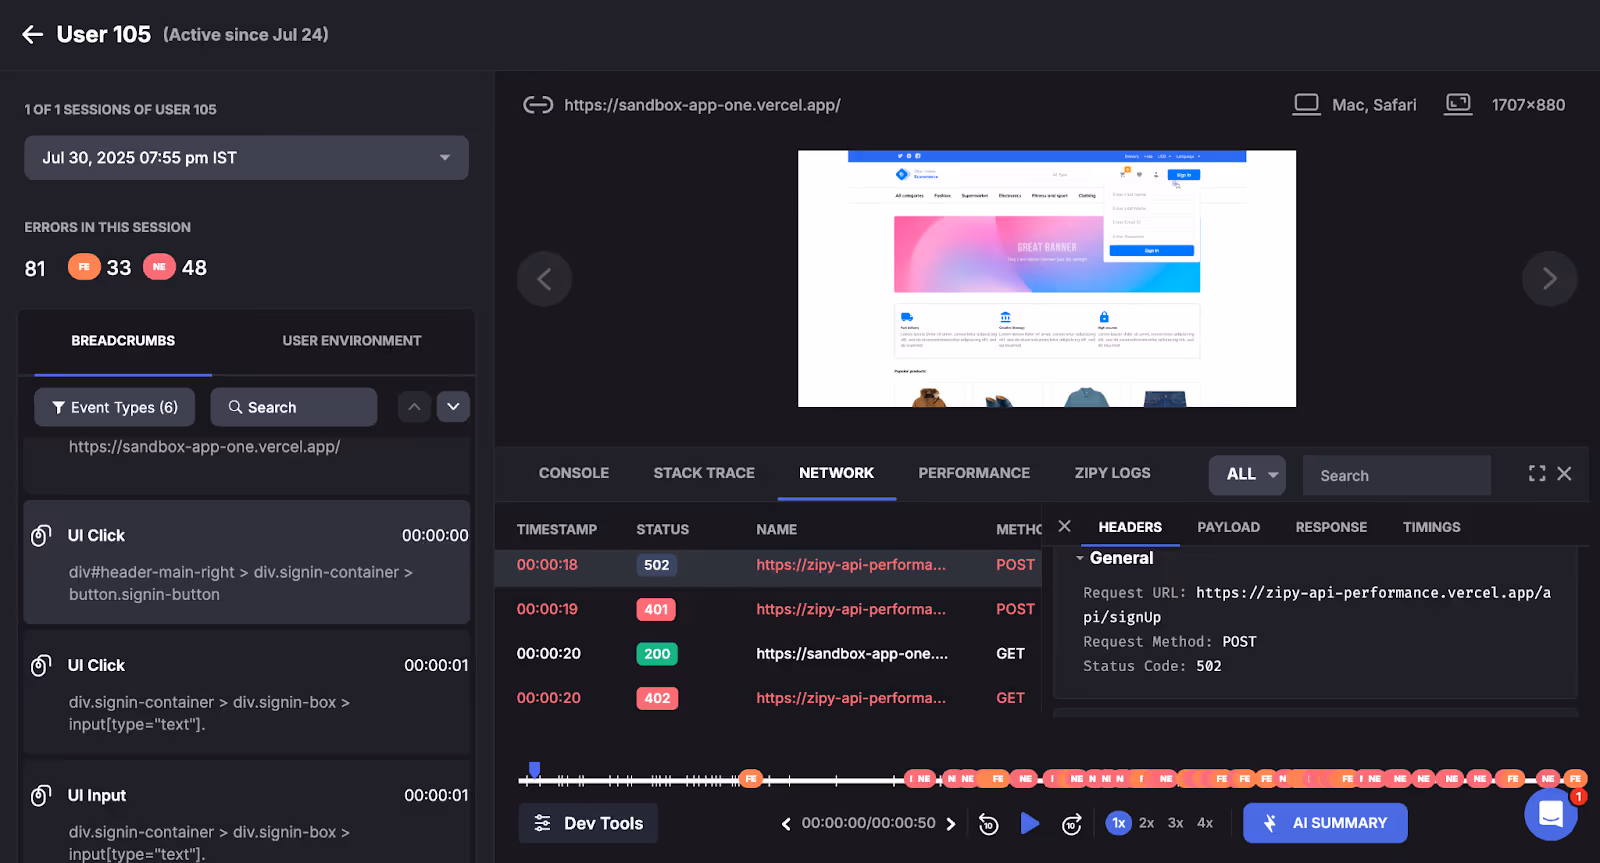
Step 4 - Validate backend impact in the Network tab
Switch to the Network panel.
Open a failing request to inspect the method, URL, headers, request body, and response payload. Look for correlation/request IDs for backend tracing.
Decision: Does the UI error follow a 4xx/5xx or a slow 200? If a 4xx, check validation. If 5xx/timeout, escalate to backend with full context.
Expected outcome: A named endpoint, parameters, and response that explain the UI failure or performance issue.
Step 5 - Read user breadcrumbs for intent and friction
Open the Breadcrumbs. Review clicks, scrolls, and route changes.
Look for patterns: rage clicks, dead clicks, U-turns (navigating back and forth), and abandonment right after an error.
Decision: Is the problem user-driven (misleading UI) or system-driven (backend/JS failure)? Decide if the fix is UX or code.
Expectedoutcome: A clear reproduction path in plain language: “From dashboard, click ‘Export’, select CSV, submit → 500 on /export.”
Step 6 - Correlate with Errors/Issues to assess impact
Review event volume, affected users, environments, and last seen times. Check if the error is new or tied to a recent release.
Decision: If it’s a known issue, attach your new reproduction path. If new, create a tracked issue with severity and blast radius.
Expected outcome: You know whether to hotfix, roll back, or schedule the fix, and you have an issue to route to owners.
TIP: Mark the error as resolved or unresolved in the error classification section to see if this issue persists later.
Step 7 - Capture the insight and share it quickly
Take note of the exact timestamp; include the user action, failing request, and stack line in one sentence.
Copy the link to the session using the share URL button. Share it with your team or attach it to Jira/DevOps.
Decision: What is the smallest reproducible step set, and who needs it? Frontend-only, backend-only, or both?
Expected outcome: One actionable insight ready to fix, with evidence that plays back in seconds.
Ready to move faster? Open Session Replay in Zipy now and find your first actionable insight
If you have any more questions feel free to reach out to us at support@zipy.ai.
Can I filter replays to only sessions with backend errors?
Yes. In Session Replay, filter for error category to be “Backend Errors”
Do replays include network request bodies?
Yes, session replay does include network requests and response bodies. If you don't see them, they may be disabled for your account. Contact Zipy support in such a case.
How do I get readable stack traces instead of minified code?
Upload source maps for your build. Then, revisit the session for complete stacks.
Can I share a replay at a specific timestamp?
Yes. Copy the session link while paused at the desired time; Zipy will preserve the context for your teammates.
Wanna try Zipy?
Zipy provides you with full customer visibility without multiple back and forths between Customers, Customer Support and your Engineering teams.
.svg)

.webp)


.webp)
.svg)


.webp)