See Frontend Errors Clearly. Fix Them Instantly.
Try for free
.svg)

.webp)
Ever spent hours trying to chase down a mysterious frontend bug?
It feels like searching for a missing sock - frustrating, elusive, and just when you think you've found it, another issue pops up!
Frontend errors often hide behind cryptic error messages, inconsistent user reports, and confusing logs, making debugging feel more like solving a tricky puzzle without seeing all the pieces.
But don’t worry - you're not alone, and there’s an easier way to unfold these mysteries!
Before you can catch errors, you need to set up Zipy in your app. It’s super easy and only takes a minute or less!
Firstly, you need to create a free account on Zipy by signing up and completing the onboarding process. From there, you have two options for installing zipy in your application.
You can do this by adding just two lines of Zipy's JavaScript SDK to the <head> section of your web app’s HTML page. This makes sure Zipy starts tracking from the very beginning of the user’s session.
<script src="https://cdn.zipy.ai/sdk/v1.0/zipy.min.umd.js"
crossorigin="anonymous"></script>
<script> window.zipy &&
window.zipy.init('YOUR_PROJECT_SDK_KEY');</script>You can also install Zipy in your web application via NPM. For that, the first step you need to do is to install Zipy module in your app project as follows.
npm i zipyaiThen you need to import the Zipy module in your application and initialize it in your app.js or any other source file as follows.
import zipy from 'zipyai';
zipy.init('YOUR_PROJECT_SDK_KEY');
In both the above methods, you will find “YOUR_PROJECT_SDK_KEY” in the project settings of your zipy account.
After doing this go on to session replay and verify whether sessions starts recording automatically.
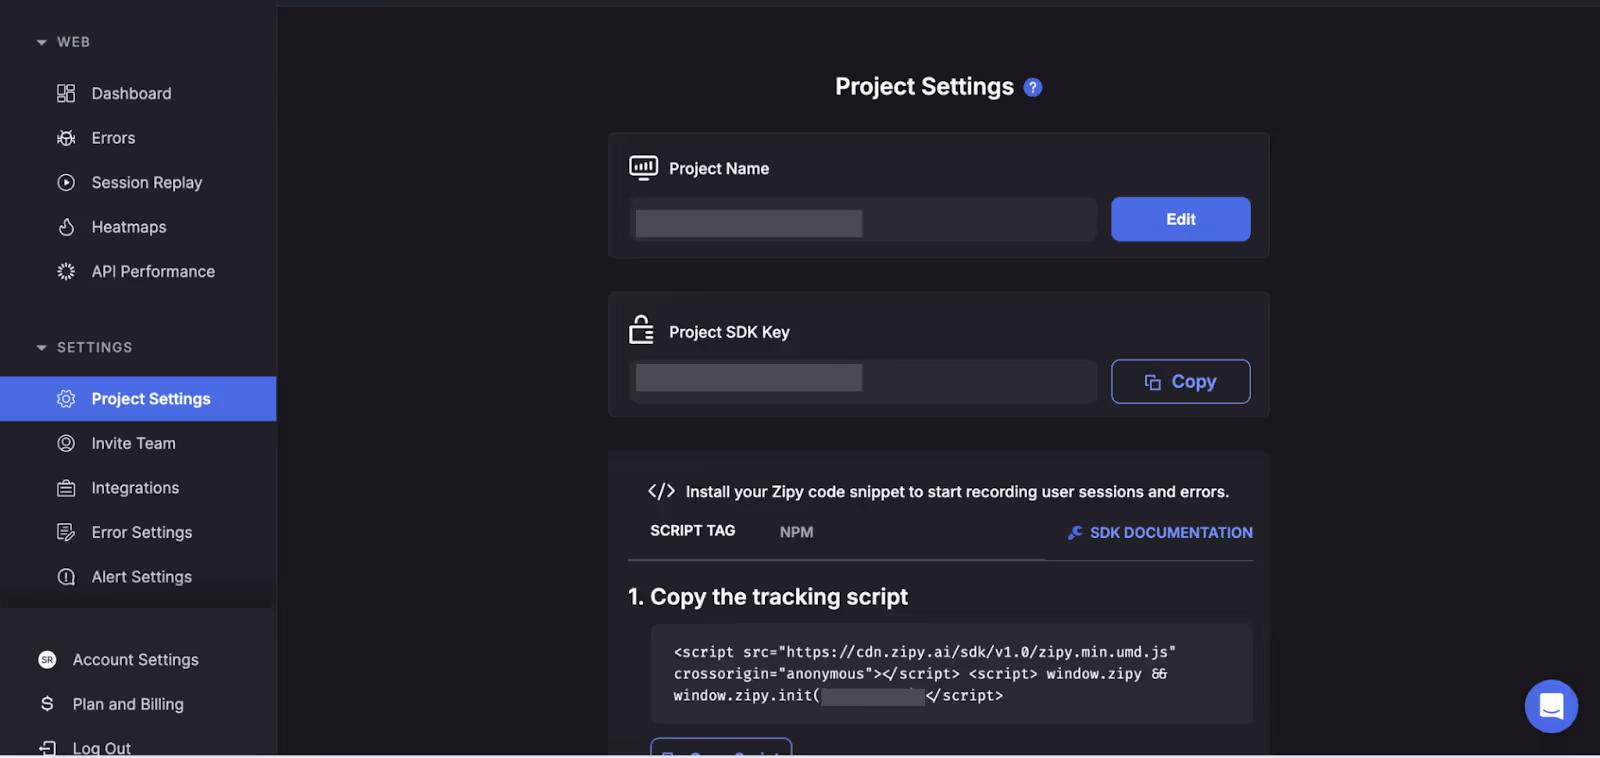
(Here, as you can see in the image, the Project SDK Key is present in the project settings.)
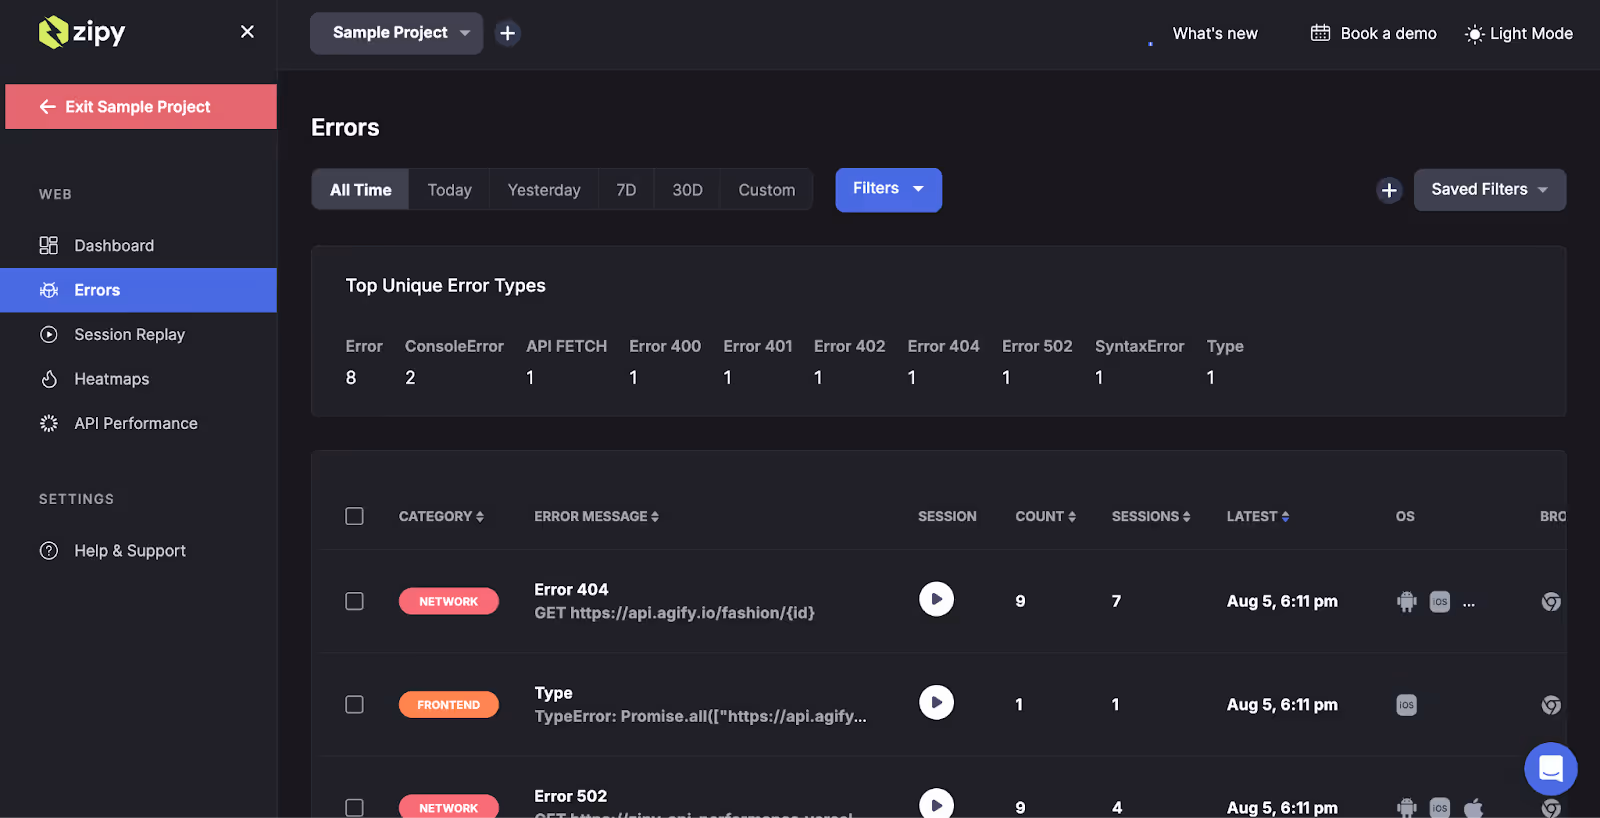
The Error Classification Dashboard gives you an overall view of all the errors encountered by your users. Each error is grouped and categorized, making it easier to identify recurring issues and prioritize what needs to be fixed first.
As you can see in the image, in the error classification dashboard, you can see the error category, error message, button to play sessions, error count denoting the severity of the issue, sessions where the particular issue was encountered, latest occurrence of the issue, and user environment like OS and browser.
On the Error Classification Dashboard, click “Filter” to narrow down the error list.
Use filters to focus on:
This helps you to quickly go on to the exact issue you're trying to debug.
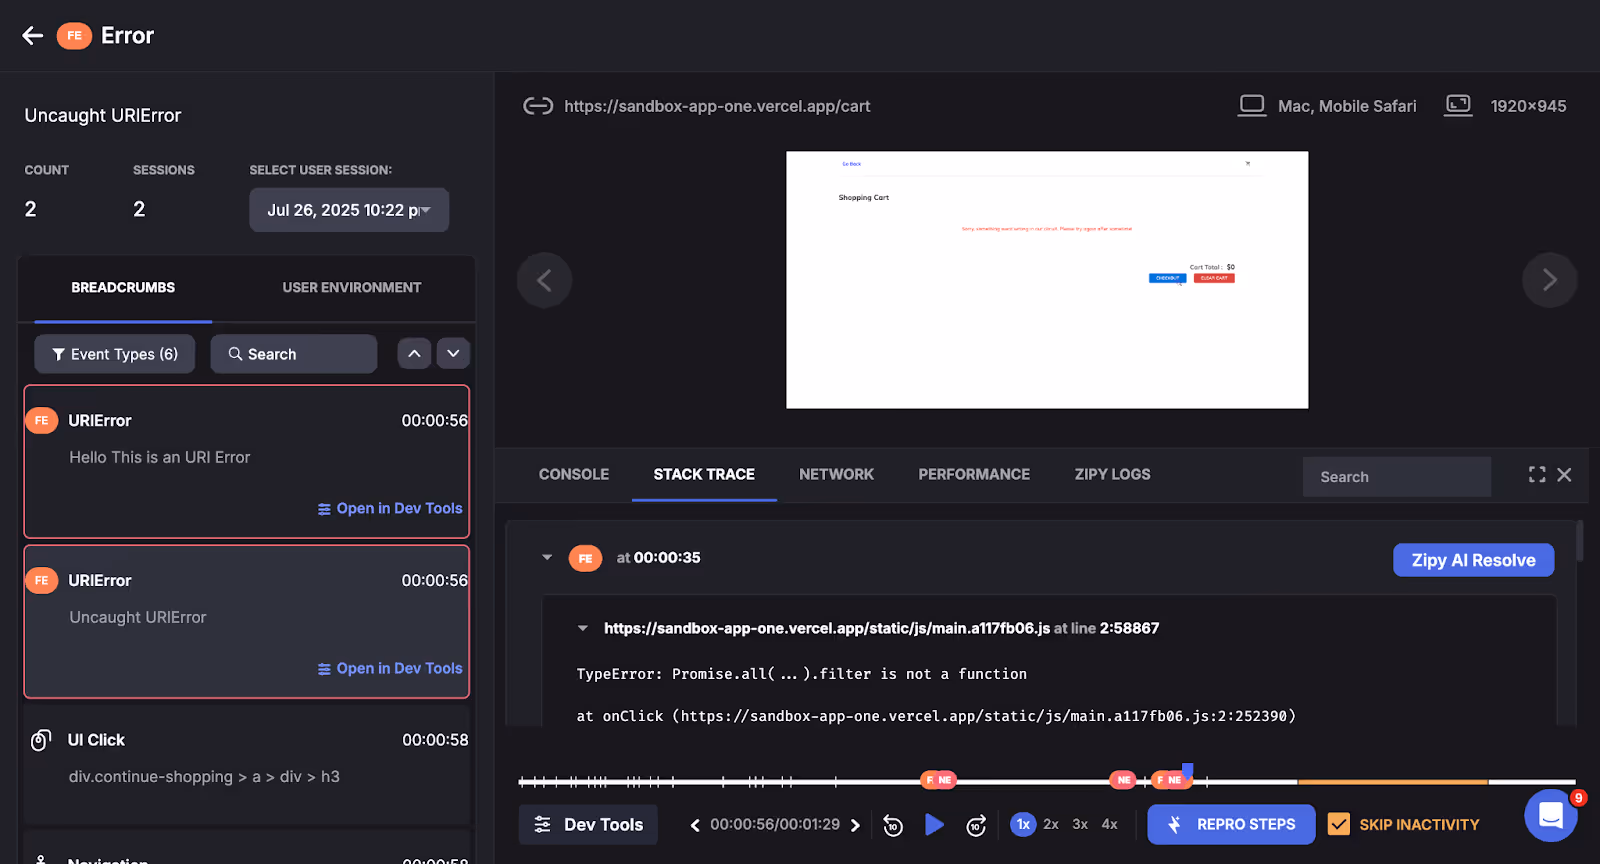
Click on the error to open the associated user session. Zipy provides a full session replay video that shows exactly what the user did before the error occurred - clicks, navigations, inputs, and more.
While watching the session, check these key areas:
This step helps you reproduce and understand the issue exactly as the user experienced it.
Use the recorded session data to reproduce the bug in your local environment. The console logs, network requests, and breadcrumbs provide all the clues you need.
Once you've identified the root cause:
Pro Tip: Tag the error as “Resolved” in Zipy. This helps you track if the issue reappears and measure its impact over time.

See how thousands of Engineering, Product and Marketing Teams are accelerating their growth with Zipy.

.webp)
If you have any more questions feel free to reach out to us at support@zipy.ai.
.svg)
No major changes! You just need to initialize Zipy with a script tag or npm package. After that, it works in the background without affecting your app’s performance.
Yes, Zipy supports SPAs and automatically tracks navigation, user actions, and dynamic errors across routes.
Yes. Zipy masks sensitive data and follows best practices to protect user privacy. You can also configure what gets tracked or excluded.
Zipy provides you with full customer visibility without multiple back and forths between Customers, Customer Support and your Engineering teams.
The unified digital experience platform to drive growth with Product Analytics, Error Tracking, and Session Replay in one.


.webp)