Want to see bugs the way your users do? Sign up for Zipy and try it yourself.
Try for free
.svg)

.webp)
Sometimes debugging feels like hunting for that one weird click in a sea of thousands. You’ve been there, right? You’re staring at logs thinking, What exactly did the user do before that error? Where did it all go sideways?
That’s where Zipy’s event filtering and search save the day. Because let’s be honest - who wants to scrub through an hour-long replay hoping to spot the one weird click? Not you, right?
With filters, you just slice straight down to the clicks, inputs, API calls, or errors that matter. Suddenly, you’re not wandering blind - you’re actually hunting with a map. Much better.
It’s basically a magnifying glass for session replays. Suddenly, instead of drowning in noise, you’re staring right at the signal. Pretty neat, what do you think?
Wanna see how it actually works? Let’s walk through it.
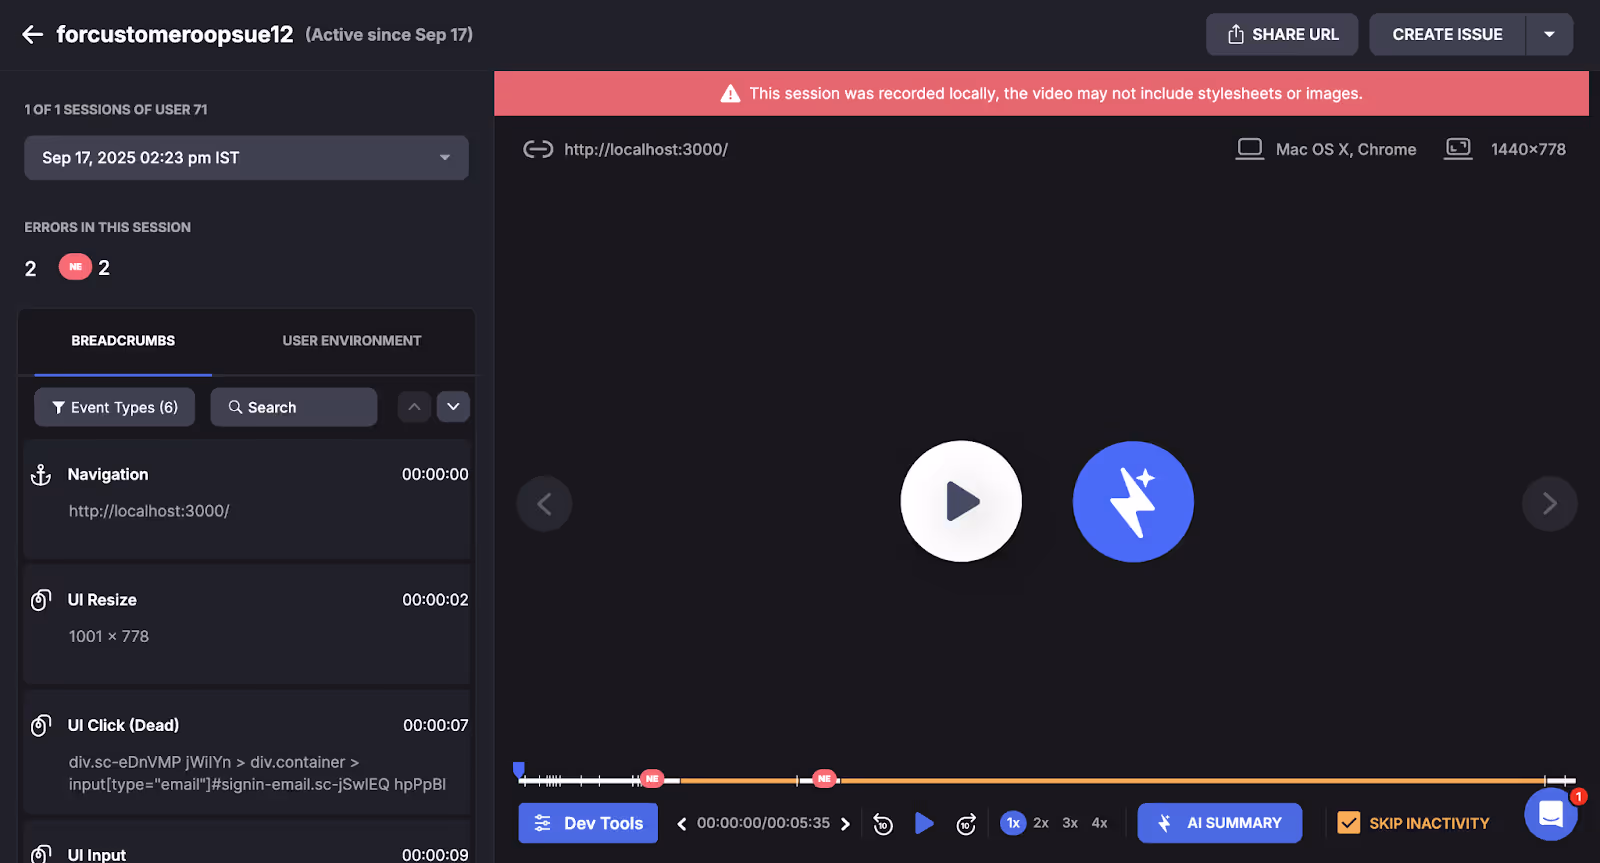
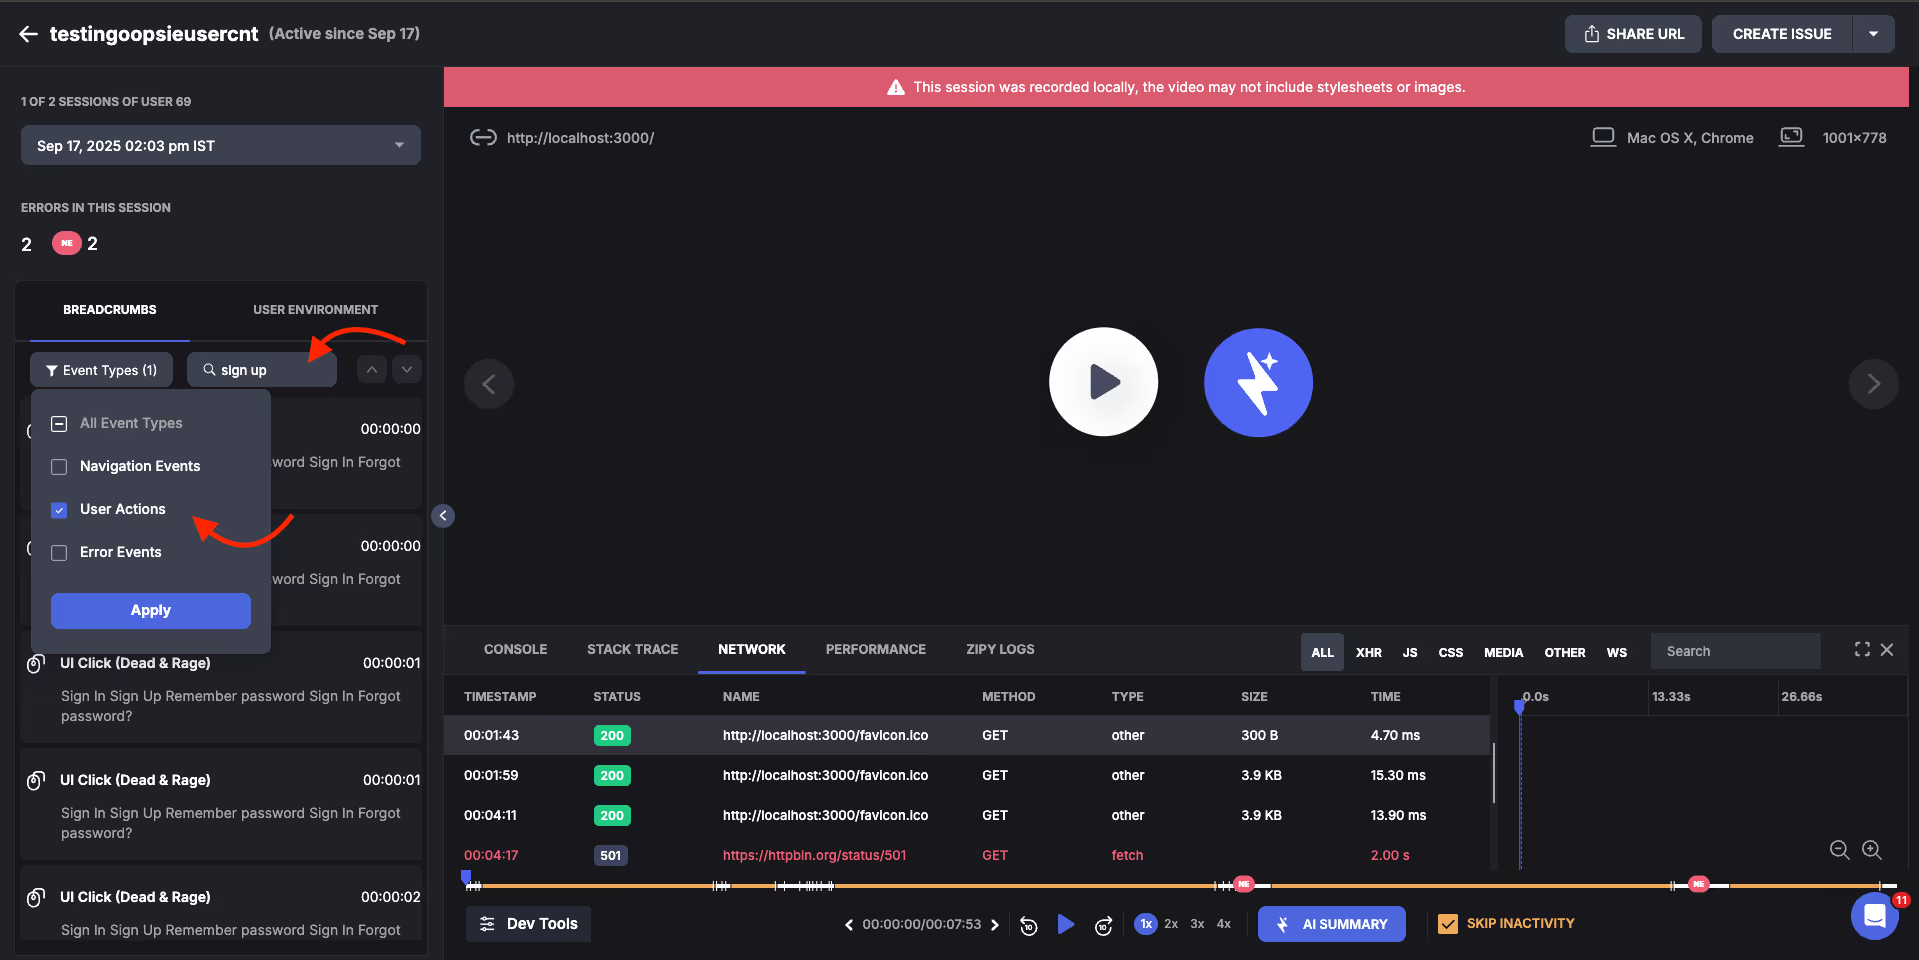
Open up a session replay. See that panel on the side? That’s the Breadcrumbs - it’s like a running log of everything the user did. Now click the little Filter dropdown. WHOA! So many checkboxes. User actions! Console events! Random stuff! You can check/uncheck what you care about. Want to see only Navigation Events? Uncheck everything else. Want to see the entire mess? Keep it all on. It’s your call.
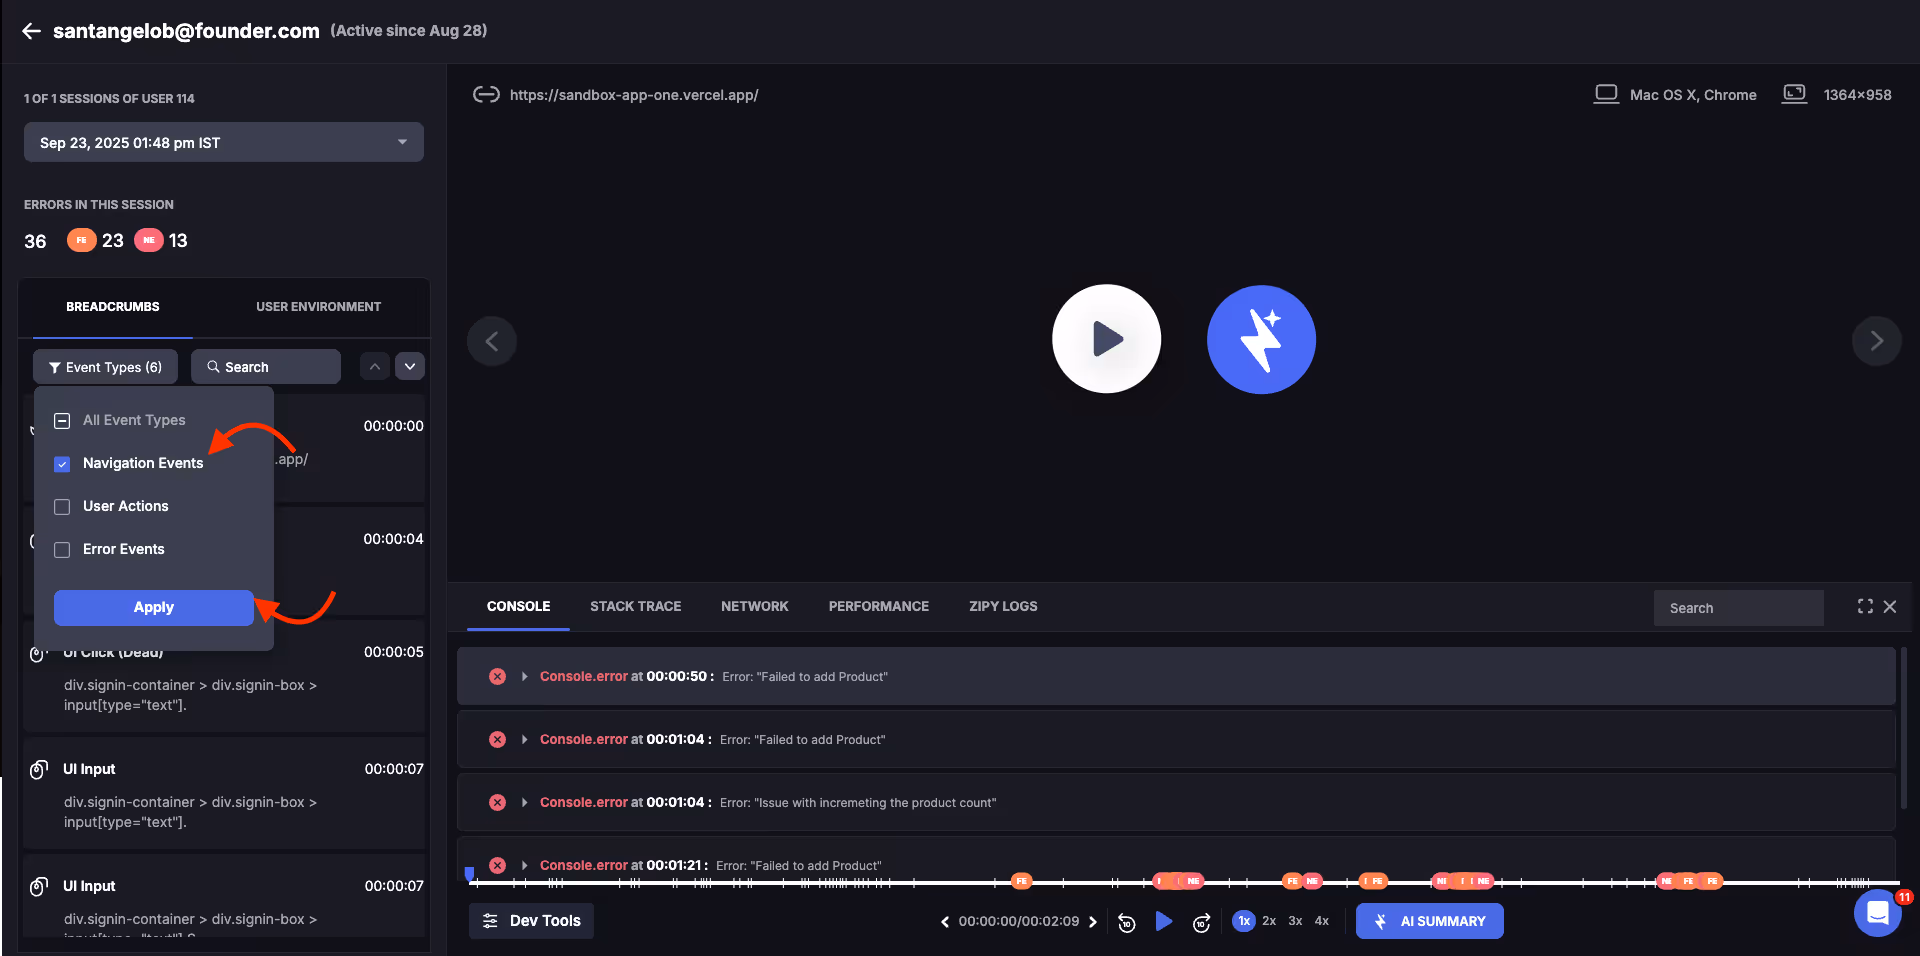
Okay, let’s play with this a bit. Uncheck everything except “Navigation Events.” Now your breadcrumbs are clean - just page loads, URL changes, that kind of thing. Super chill.
Now click “User Actions” instead. WHOA. Suddenly, you're seeing clicks, rage clicks, dead clicks, inputs, - it’s like turning on the lights in a room full of tiny user moments.
You’re not just filtering events, you’re zooming in on behavior. And it feels kinda awesome.
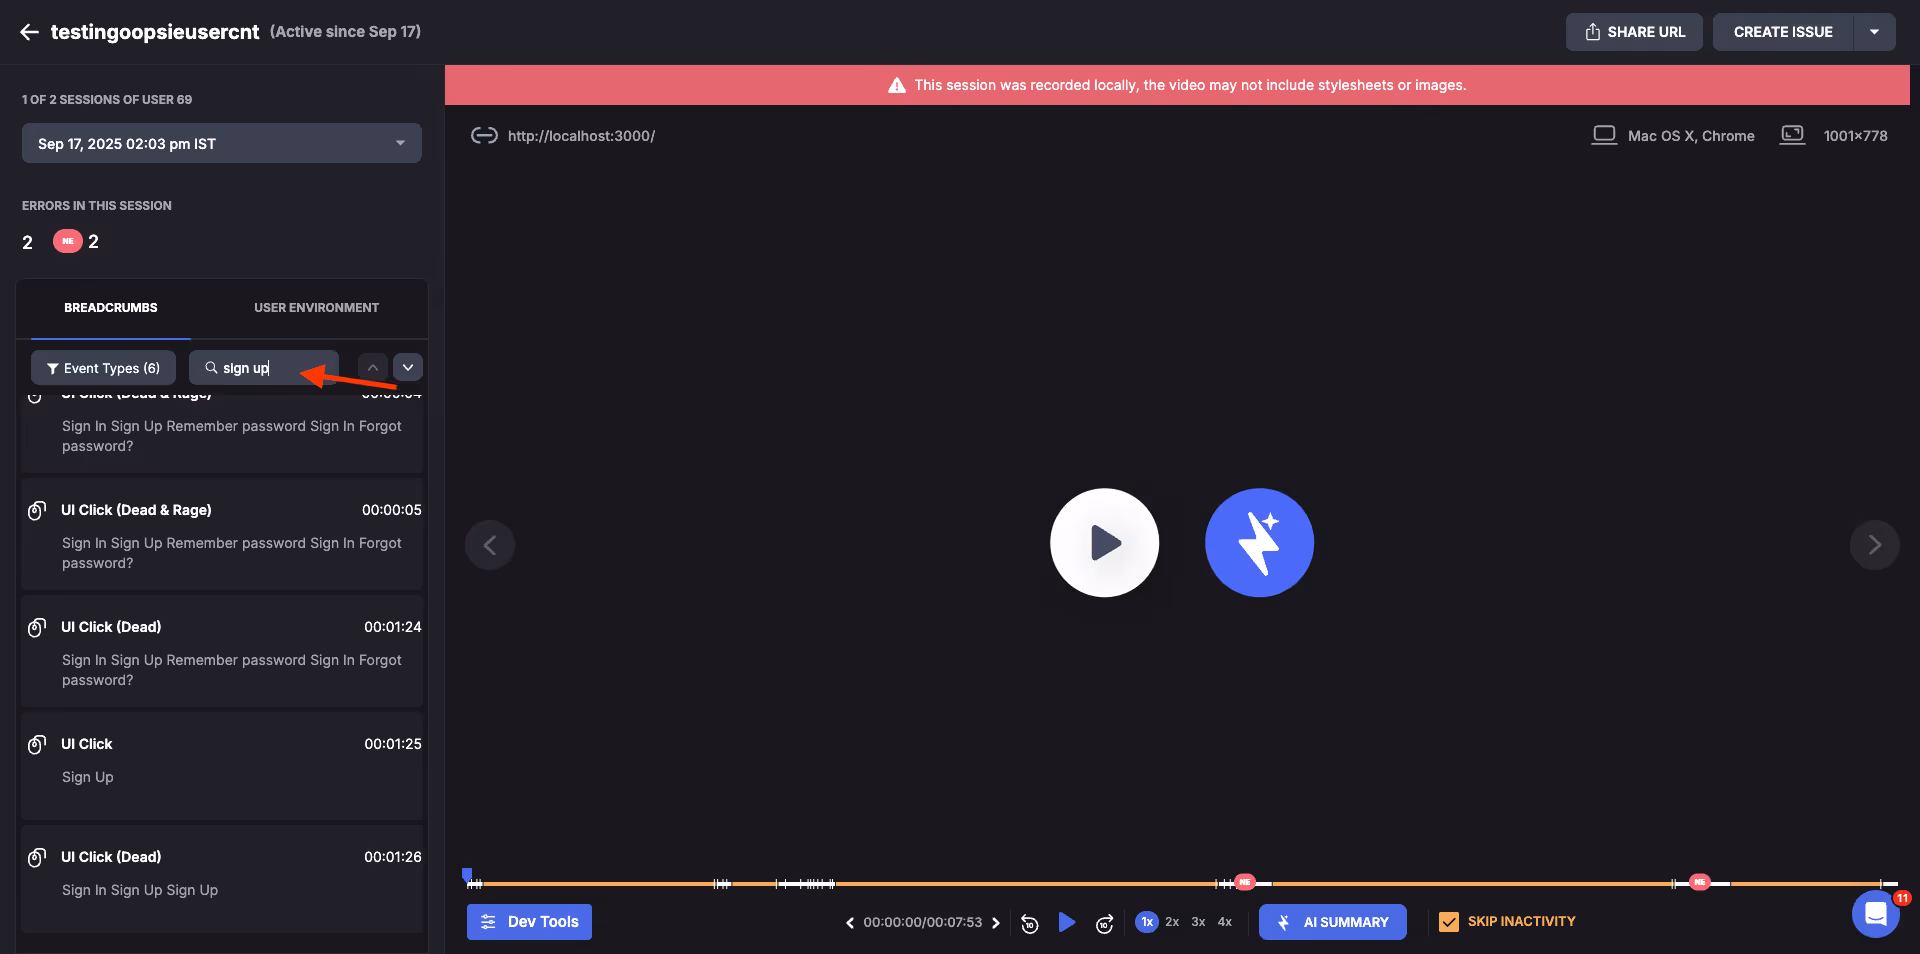
Let’s say you’re hunting for a login issue. Type "login" into the search box at the top of the Breadcrumbs panel. You get a filtered list of only the events that mention it right away. No digging through noise.
It’s like telling Zipy, “Hey, just show me the good stuff.” Super useful when you're chasing down one specific bug or trying to follow a user’s path through login land.
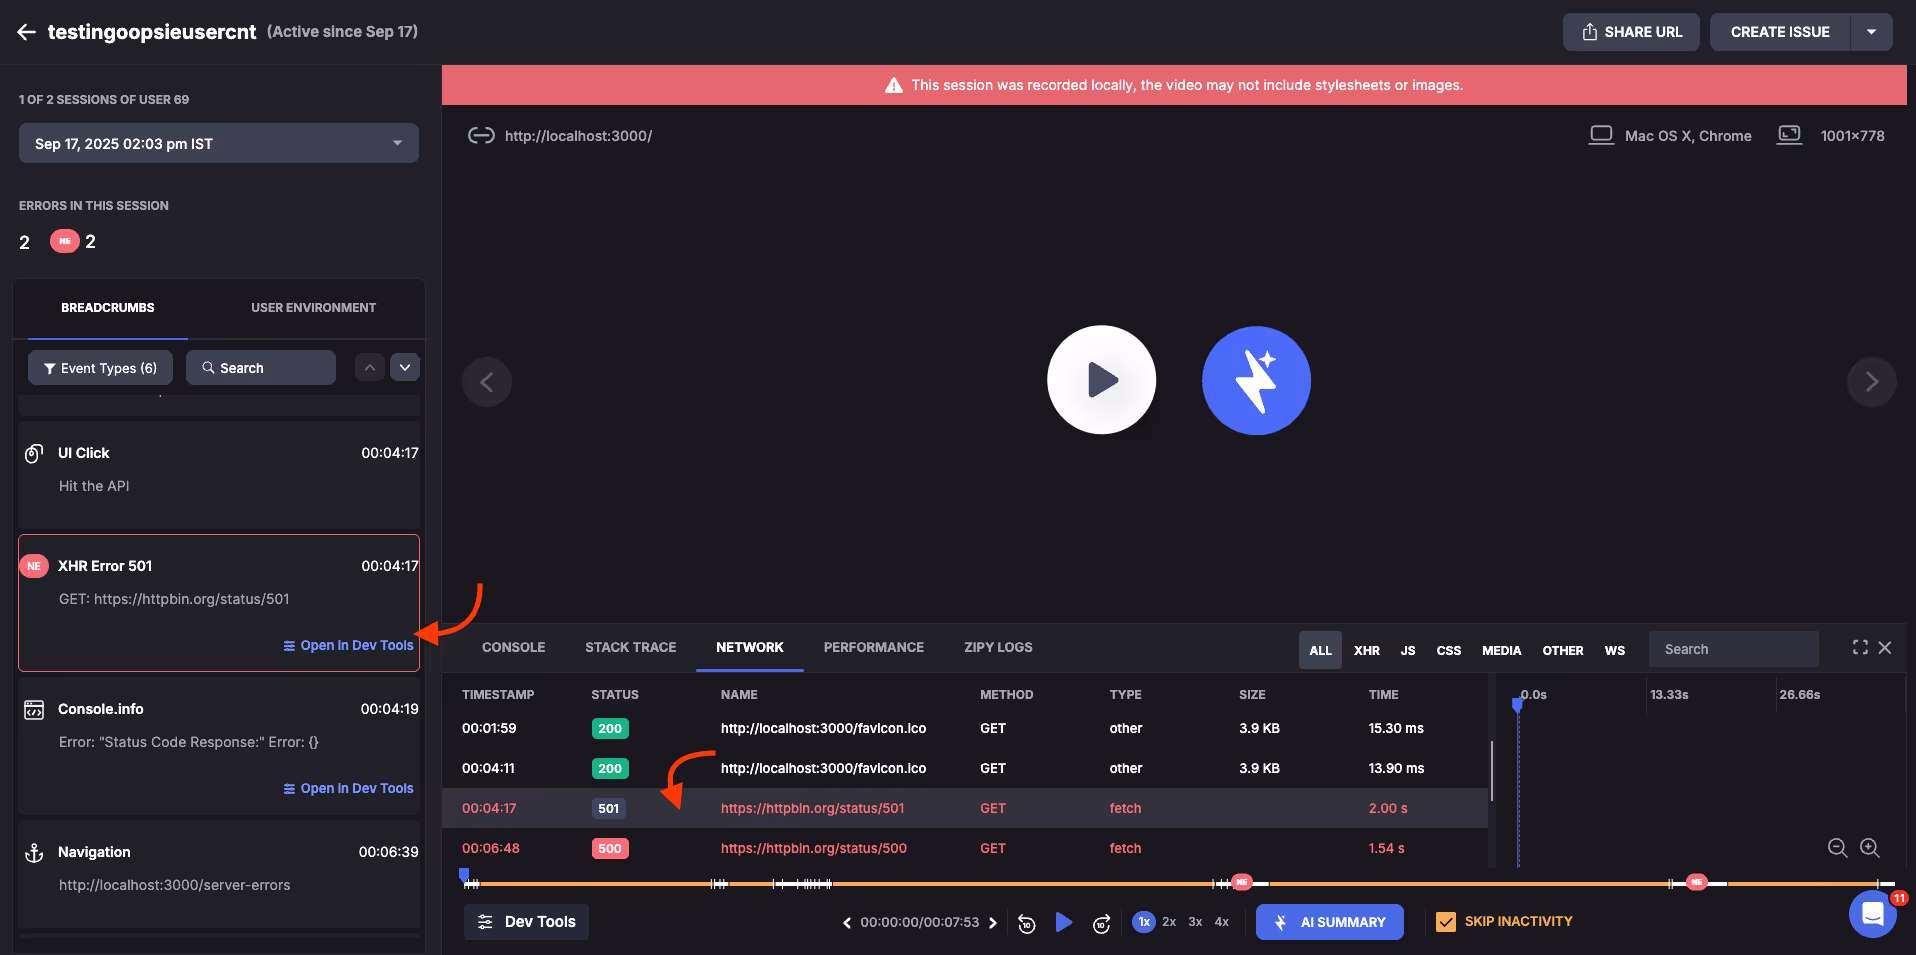
Found an error event that looks juicy? Click it! For real. If it’s an Error, a Zipy Log, or a Console Event, you’ll see a little option: Open in DevTools.
Click that and BOOM! - It jumps you right into DevTools at the exact moment that event happened. No scrubbing. No guessing.
It’s like time travel, but for debugging.
Okay, now you’re officially in detective mode. Let’s try something together.
Flip on the “User Actions” filter. Then, in the search bar, type “submit.”
See what happens? Suddenly, you’re only looking at events where users clicked submit buttons.
Neat trick, isn’t it?
And here’s where it gets fun - you can stack filters and searches together. That means you’re not just watching a replay, you’re shaping it into your own little bug-hunting dashboard.
Want to find the exact moment things started getting weird? This is how you zoom right in. No noise, no fluff - just the clues you actually care about.

See how thousands of Engineering, Product and Marketing Teams are accelerating their growth with Zipy.

.webp)
If you have any more questions feel free to reach out to us at support@zipy.ai.
.svg)
Yes, but it will broaden up the result and you may find it difficult to get the required event
Pretty much anything. If the event contains the string you type, it’ll show up. Simple enough?
Not quite. You can only do that from Error Events, Zipy Logs, and Console Events. Think of it as a shortcut that only shows up where it makes sense.
Zipy provides you with full customer visibility without multiple back and forths between Customers, Customer Support and your Engineering teams.
The unified digital experience platform to drive growth with Product Analytics, Error Tracking, and Session Replay in one.


.webp)