.svg)

.avif)
.webp)
Zipy's Heatmaps is a great tool for visual analytics that shows you exactly how people interact with your app or website. With colour-coded overlays and visual representations, you can see where users click, how far they scroll, and where they get stuck. By looking at these patterns of interaction, you can find usability problems, make page layouts better, and get rid of things that stop conversions.
What Makes Zipy Heatmaps Unique
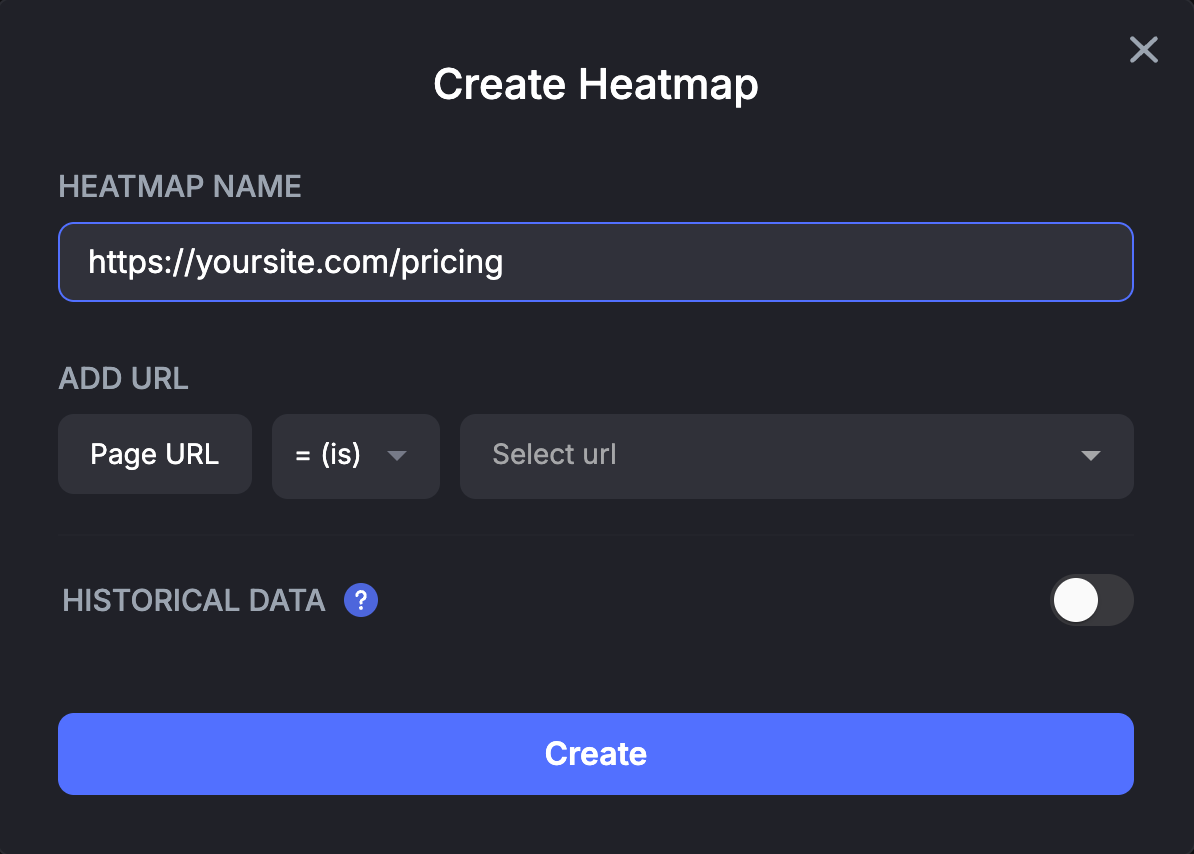
Choices for Matching URLs:
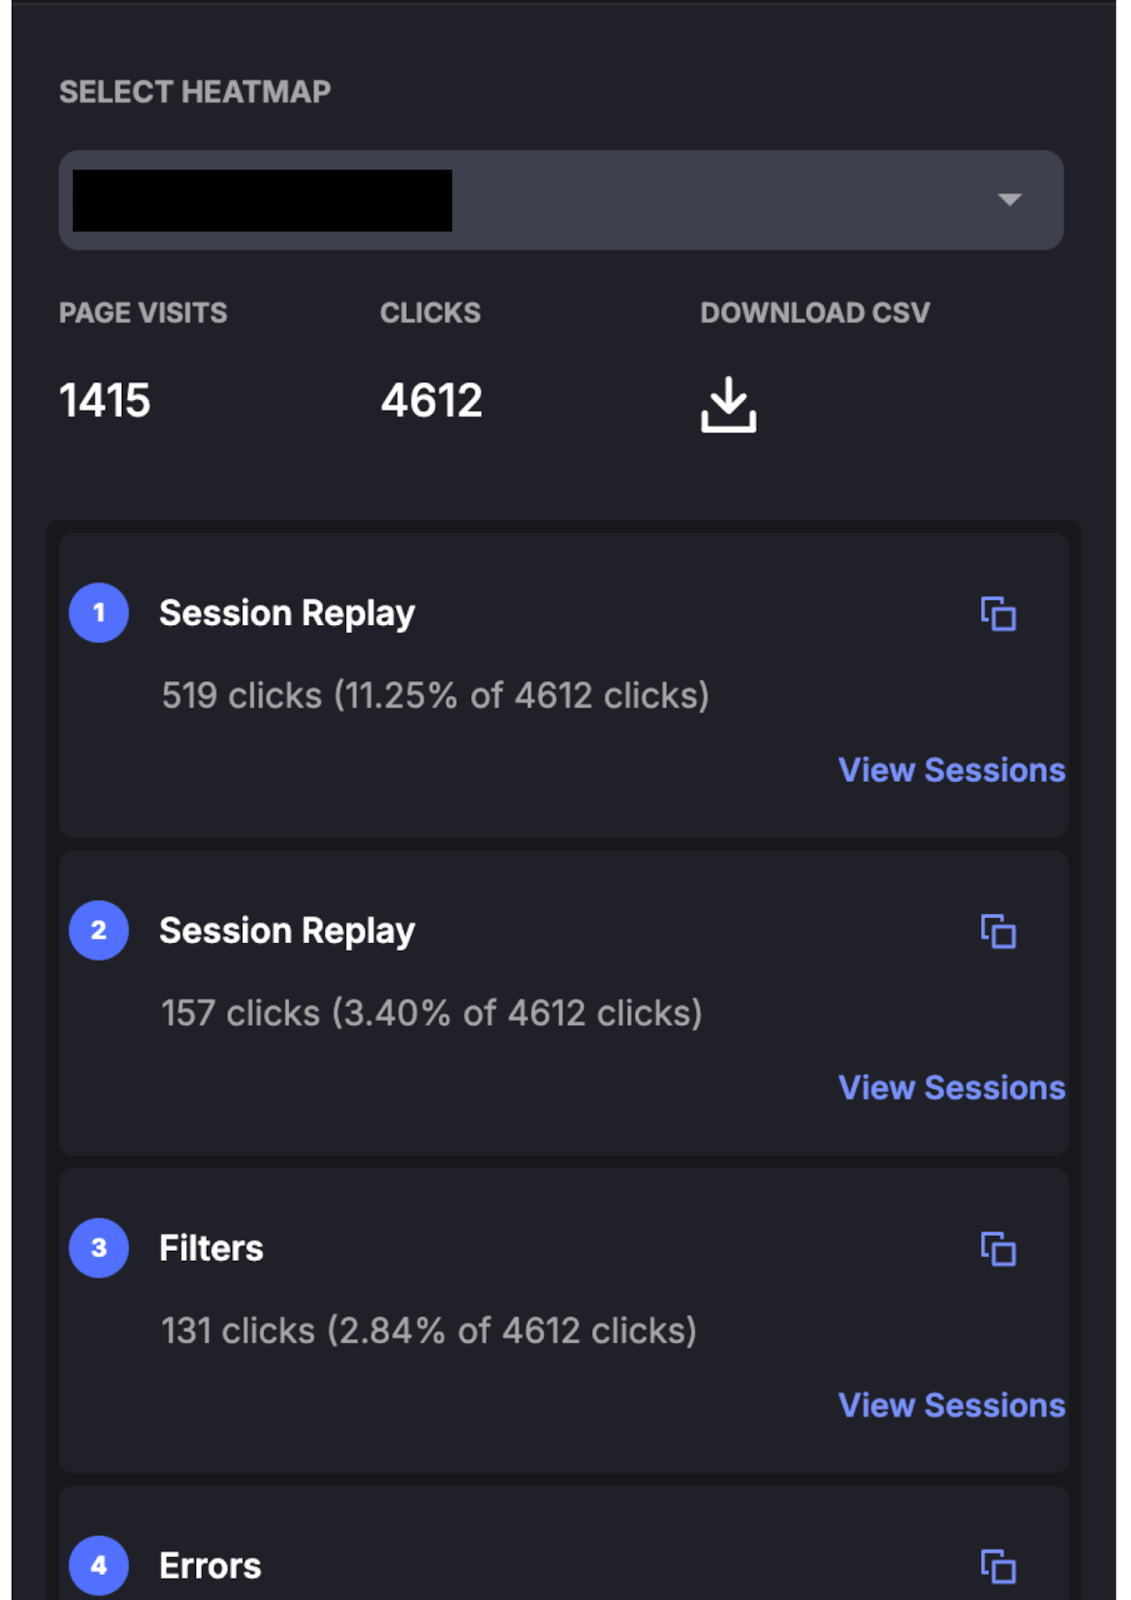
Heatmaps give you a lot of valuable information:
What you will see:
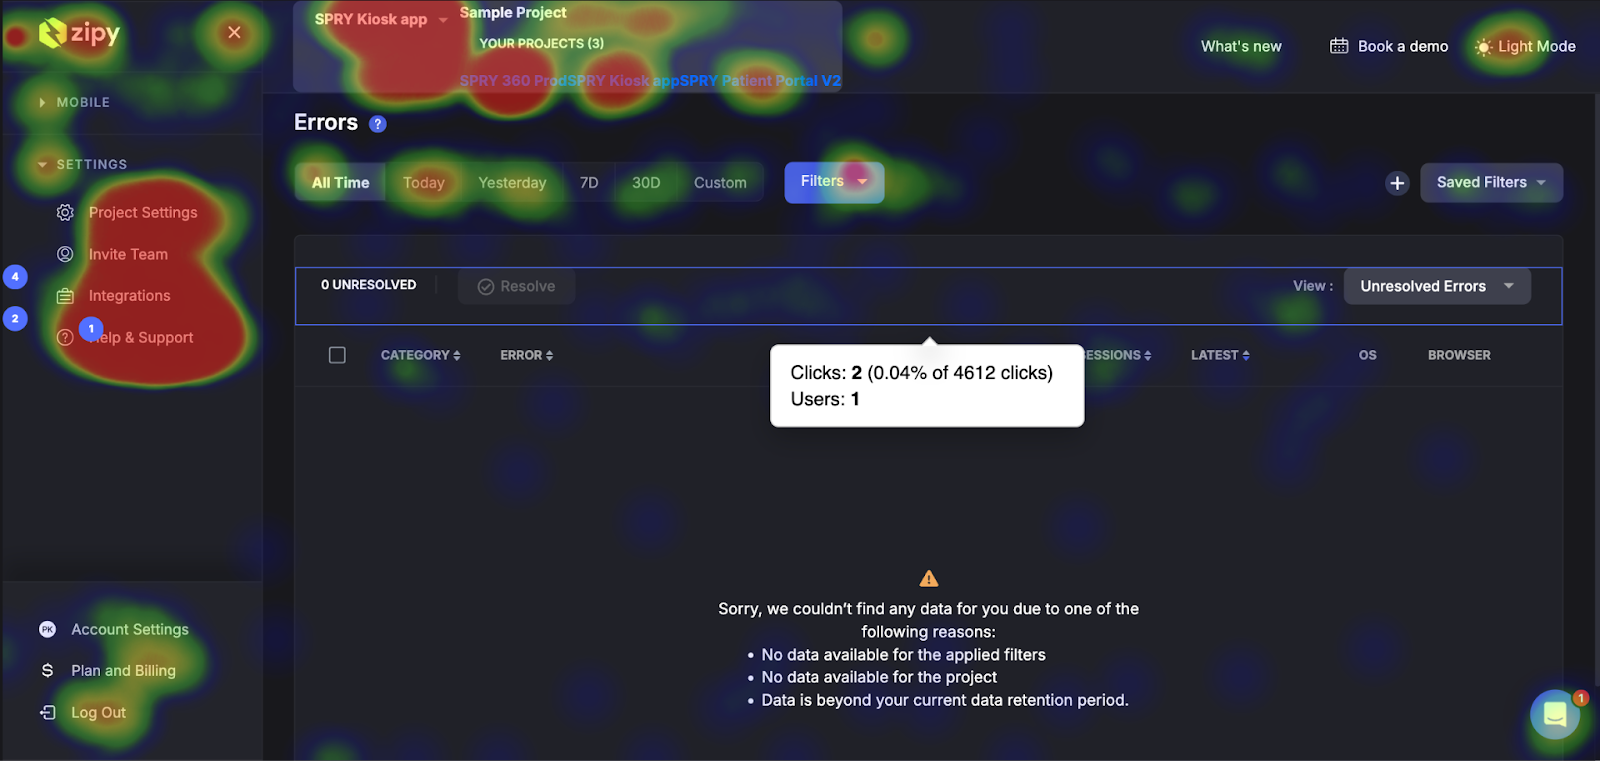
Major Issues:
How to use this information:
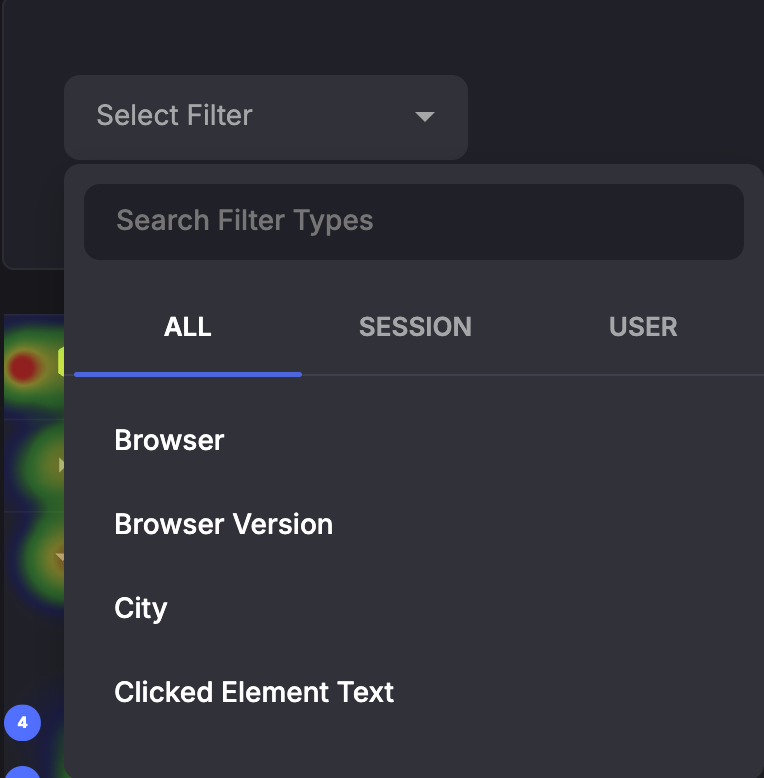
There are a lot of filters in Heatmaps that can be used to make sure that every problem is solved quickly and completely.
Why filtering is important: Users often behave in very different ways. A dead click might only happen on mobile devices, and a rage click might happen among people who saw a certain ad.
This is where Zipy's integration really shines. You can easily go from quantitative heatmap data to qualitative session analysis.
How to watch the Session Replays:
Before you make any changes, write down your current state in exact numbers.
The Insight: "65% of users scroll past our main call to action, and every day we get 45 rage clicks on the 'Buy Now' button."
The Worth: You can now use real numbers to see how much better things are getting and how much money your optimisation efforts are making you.
This is what sets Zipy apart from other heatmap technologies.
The Mechanism: After reading your Heatmap, move straight to your Session Replays.
The Discovery: Users might not be scrolling because the hero image takes a long time to load, or they might be rage-clicking because a button makes a form validation mistake without clear feedback.
Some issues are more important than others. Focus on the things that matter most for reaching your business goals.
Important: Clicks on the payment confirmation button have a direct effect on sales, fix this right away.
Medium Priority: Dead clicks on a secondary navigation element don't stop people from getting to where they want to go, but they do make the experience a lot worse.
Low Priority: If a blog post doesn't get a lot of traffic, it's fine to wait on scroll depth issues.
Efficiency: Engineering teams can spend less time fixing problems that have been shown to hurt business metrics and more time fixing problems that haven't been shown to hurt business metrics.

See how thousands of Engineering, Product and Marketing Teams are accelerating their growth with Zipy.

.webp)
If you have any more questions feel free to reach out to us at support@zipy.ai.
.svg)
Zipy provides you with full customer visibility without multiple back and forths between Customers, Customer Support and your Engineering teams.
The unified digital experience platform to drive growth with Product Analytics, Error Tracking, and Session Replay in one.


.webp)