.svg)


React Developer Tools, also known as React Tools, simplifies the process of debugging and optimizing React code. As a popular JavaScript library for building user interfaces, React has gained immense popularity among developers worldwide. However, debugging and optimizing React code can be a challenge.
With the React Devtools extension, developers can easily inspect and manipulate the state and props of components, analyze component hierarchies, and track component updates in real-time. In this blog, we will go through the features of the React Developer Tools extension, steps to set it up, and share how you can use it with examples.
Let’s get started.
What is React Dev Tools extension?
React dev tools is a browser extension meant to assist developers in debugging and optimizing React applications. It shows developers a visual depiction of the component hierarchy, properties, and state of each component in the application.
With this extension, developers can inspect and manipulate the components and their state in real-time. They can also identify performance issues in the application with its built-in profiler.
Why Should You Use the React Dev Tools Extension?
Whether you're new to the world of web development or an experienced programmer, the React Developer Tools extension is a must-have tool in your arsenal. Let's explore how this tool can enhance your development process and why it's essential for anyone working with React Tools.
1. Effortless Debugging
React Developer Tools offers a comprehensive and user-friendly debugging experience that can significantly ease the development process. This extension allows you to:
- Inspect component hierarchy: Easily view the tree structure of your React components using React Dev Tools.
- Modify props and state: Instantly tweak and adjust component properties and states to see how changes affect your application with the React Devtools Extension.
- Real-time component updates: Track updates as they happen, giving you immediate feedback on your code's behavior with React Tools.
This detailed insight into React's inner workings helps developers quickly identify and fix issues, making the debugging process not just faster but also more effective.
2. Optimize Performance
Performance optimization is crucial for creating smooth and responsive applications. React Developer Tools provides:
- Performance analysis tools: Use flame graphs and profiling to analyze rendering times and pinpoint bottlenecks with React Dev Tools.
- Identification of inefficiencies: Discover components that render too often or update unnecessarily, which can slow down your app using React Tools.
By leveraging these features, developers can fine-tune their applications, ensuring they run efficiently and deliver a seamless user experience.
3. Simplified Component Testing
Testing components is a breeze with React Developer Tools. This tool enables you to:
- Inspect individual components: Check if components receive the correct data and render as expected using React Dev Tools.
- Modify props in real-time: Simulate different scenarios and test how components behave under various conditions with the React Devtools Extension.
This level of control and visibility simplifies the testing process, ensuring your components function perfectly before they go live.
4. Ease of Product Adoption
Understanding how components interact within your application is vital, especially when onboarding new developers or collaborating with stakeholders. React Developer Tools helps you:
- Analyze component usage: Gain insights into how components are used throughout your app with React Tools.
- Communicate effectively: Use your understanding of the app’s structure to improve collaboration with team members and stakeholders.
5. Cross-Browser Compatibility
The versatility of React Developer Tools extends to its compatibility with all major browsers, including Google Chrome, Microsoft Edge, Mozilla Firefox, and Safari. This flexibility ensures that you can use this essential tool on your preferred browser without any hassle.
Conclusion
React Developer Tools is not just a handy extension—it's a powerhouse that transforms the React development experience. By integrating this tool into your workflow, you can enjoy faster debugging, performance optimization, easier component testing, better product adoption, and consistent performance across multiple browsers. If you're developing with React, this tool will undoubtedly make your work easier and more efficient with React Tools and the React Devtools Extension.
Features of React Dev Tools extension
Now that you have understood the benefits of using React Developer Tools, it’s a good time to explore some features of the React Devtools Extension.
Component Tree
The Component tree is a hierarchical representation of the React component structure in a tree-like format. The tree view displays the parent-child relationships between components, allowing developers to navigate and inspect the component hierarchy. You can expand and collapse individual components to see their child components and view their props and state using React Dev Tools.
Inspect Element Properties
With React Devtools Extension, you can view and edit the props and state of each component directly in React Dev Tools, without any modification in the source code or running application. This feature allows you to troubleshoot code and check for different scenarios efficiently.
Time-Travel Debugging
React Developer Tools offers time-travel debugging, which allows you to step through the state and props of your components at different points in time. This feature is particularly useful for checking debugging issues that occur during animations or transitions in your application.
Highlights Updates
When you make changes to your React application, React Developer Tools can highlight which components have been updated. This feature provides immediate visual feedback, helping you understand the impact of your changes.
Profiling
React Dev Tools provides profiling capabilities to measure and understand how components render and update over time. This feature offers valuable insights into the application's performance characteristics, enabling you to optimize your React application effectively.
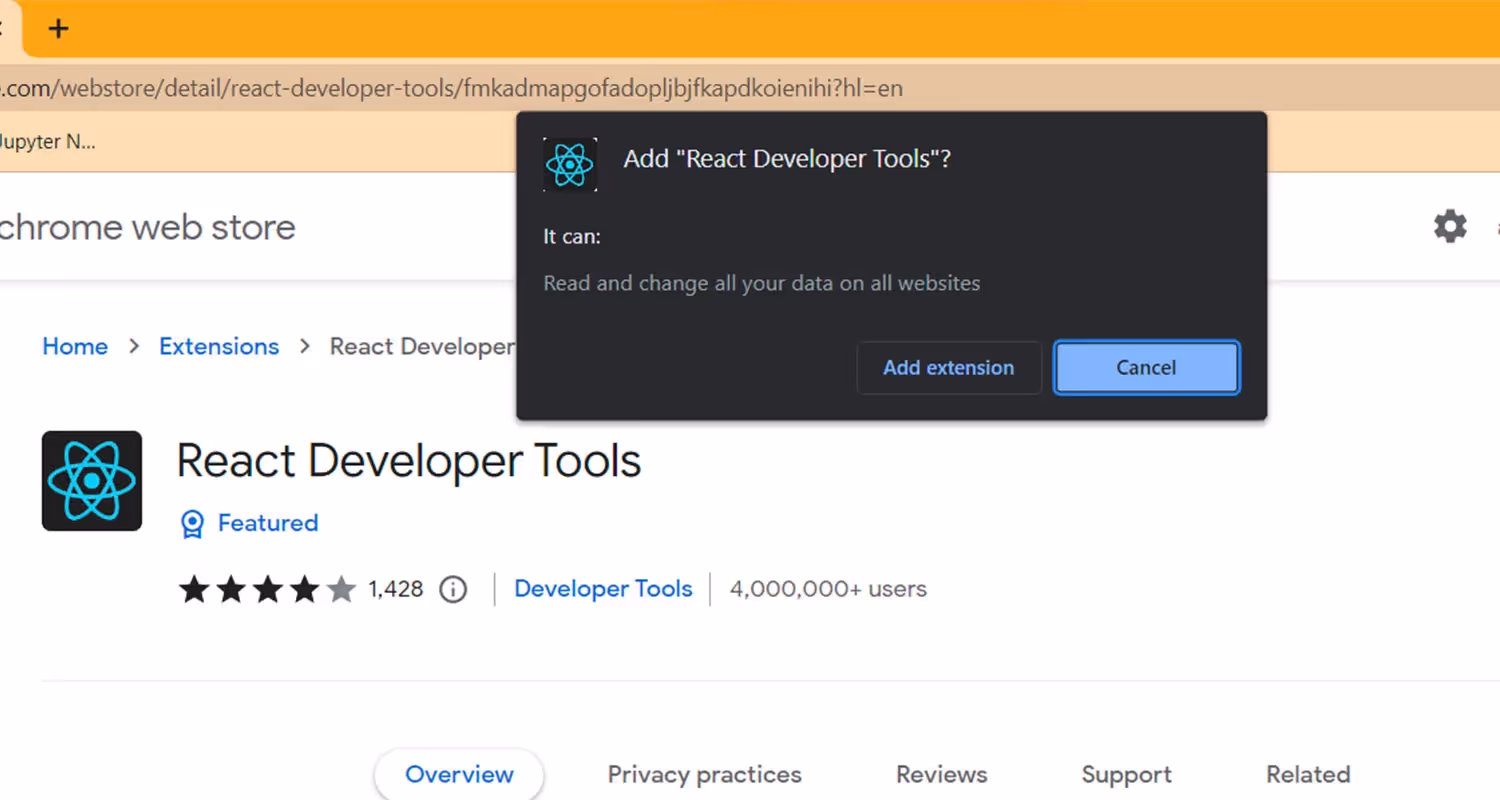
How to install React Dev Tools in Chrome
Here’s how you can install and use the React Dev Tools extension in your Chrome browser:
- Navigate to Chrome Web Store: Open Google Chrome and go to the Chrome Web Store.
- Find the React Dev Tools Extension: Search for the React Dev Tools extension in the Chrome Web Store.
- Add to Chrome: Click on the "Add to Chrome" option next to the React Devtools Extension.
- Confirm Installation: A pop-up window will appear requesting you to add the extension to Chrome. Click on the "Add Extension" button to confirm.
By following these steps, you can easily install and start using the React Developer Tools in your Chrome browser. This extension will significantly enhance your development experience by providing powerful React tools for debugging and optimizing your React applications.
To test the React Dev Tools extension, open a page containing a React application and click the "RD" icon in the top right corner of your Chrome window. The developer panel, which provides information about the React components on the page, will display on the right side of the screen.
In the performance tab of React Dev Tools, you can view information about components rendered and analyze it using the profiler. This feature of the React Developer Tools allows you to gain insights into the performance characteristics of your application, helping you optimize and debug your React components more effectively.
By using these powerful React tools, you can ensure that your application runs smoothly and efficiently.
That's it! React Developer Tools is now installed and ready to use in Chrome. Use the method to use this extension in other browsers as well.
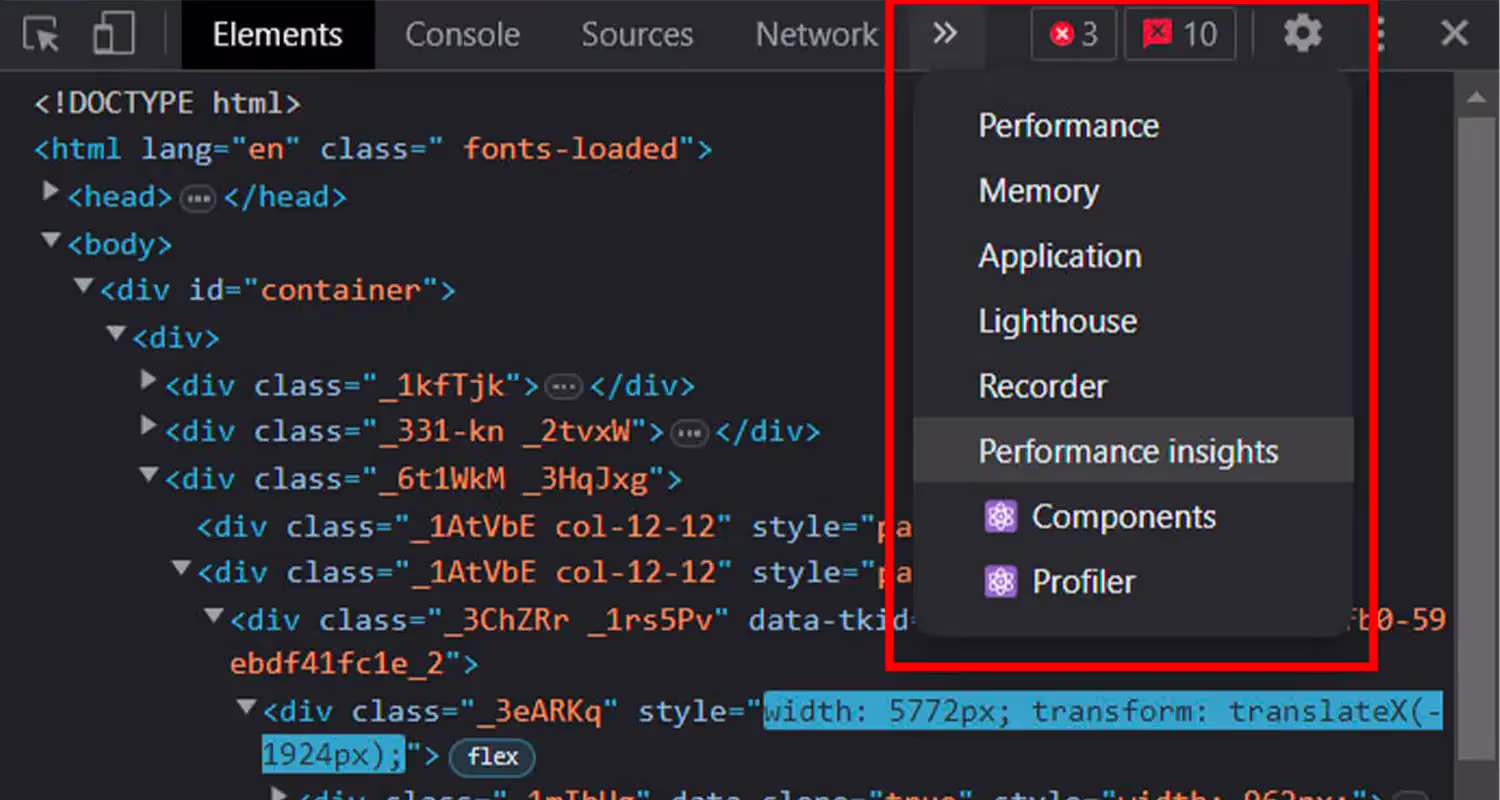
React Dev Tools - Profiler and Component
In React Dev Tools, the profiler and component serve different purposes when it comes to analyzing and understanding your React application. Let’s cover them one by one:
Component
The Components feature of the React Dev Tools extension offers a graphical view of your application's component hierarchy. It enables you to examine and troubleshoot individual components' state, props, and hooks.
By navigating to the Components tab, you gain access to a tree view presenting all rendered components in your application. When you select a particular component, you can explore its existing props, state, and context values, facilitating the process of debugging and comprehending the flow of data within your components.
For example, here is an image that showcases the component tree of a React app. You can explore the nested components and check if any error is popping off.
Using the React Developer Tools in this way provides a comprehensive view of your application’s structure, making it easier to debug and optimize your code effectively.
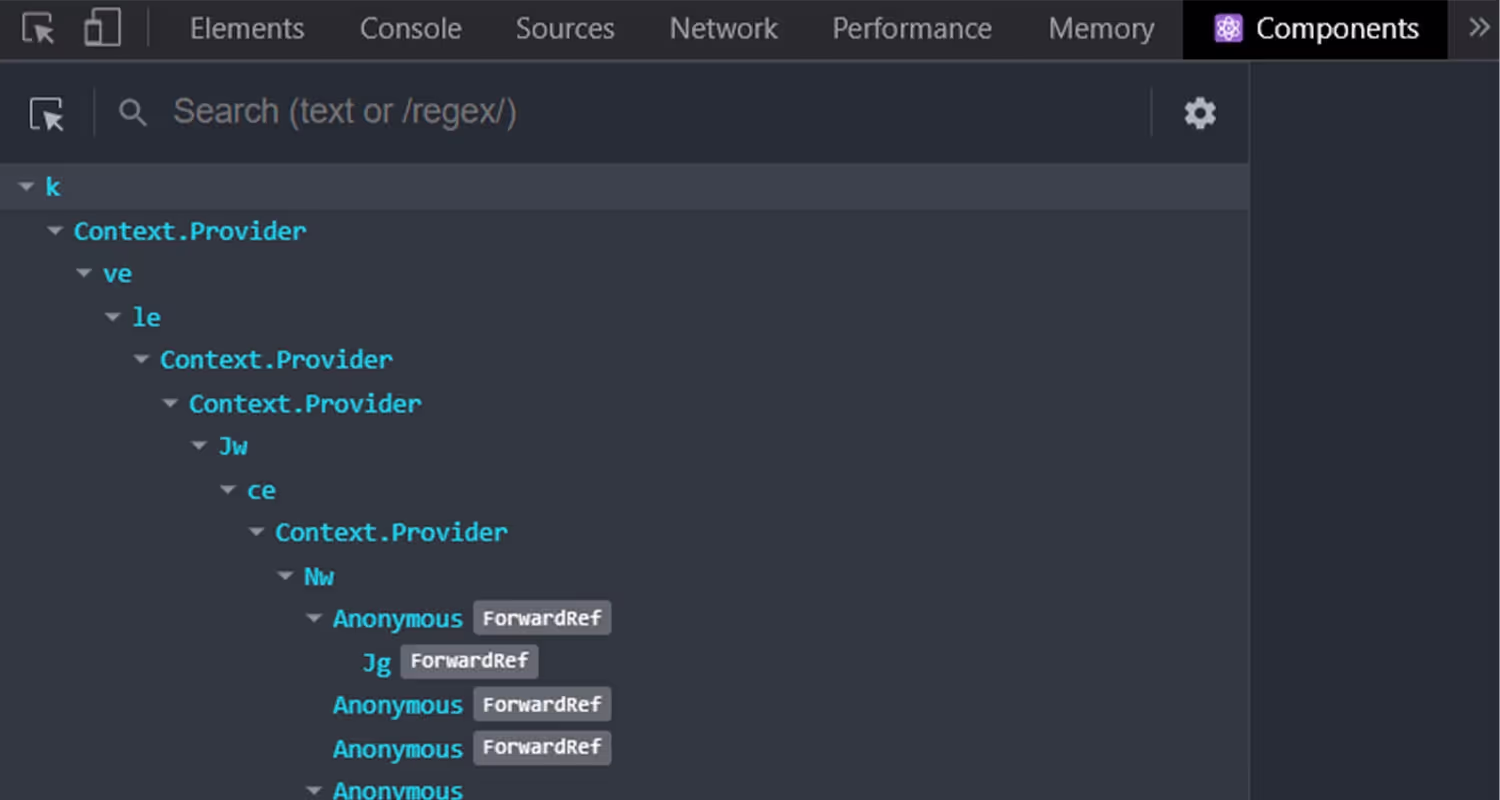
Furthermore, the Components tab provides visualization and inspection capabilities for a component's lifecycle, hooks, and the associated virtual DOM structure. This comprehensive view assists in understanding the inner workings and relationships of your components.
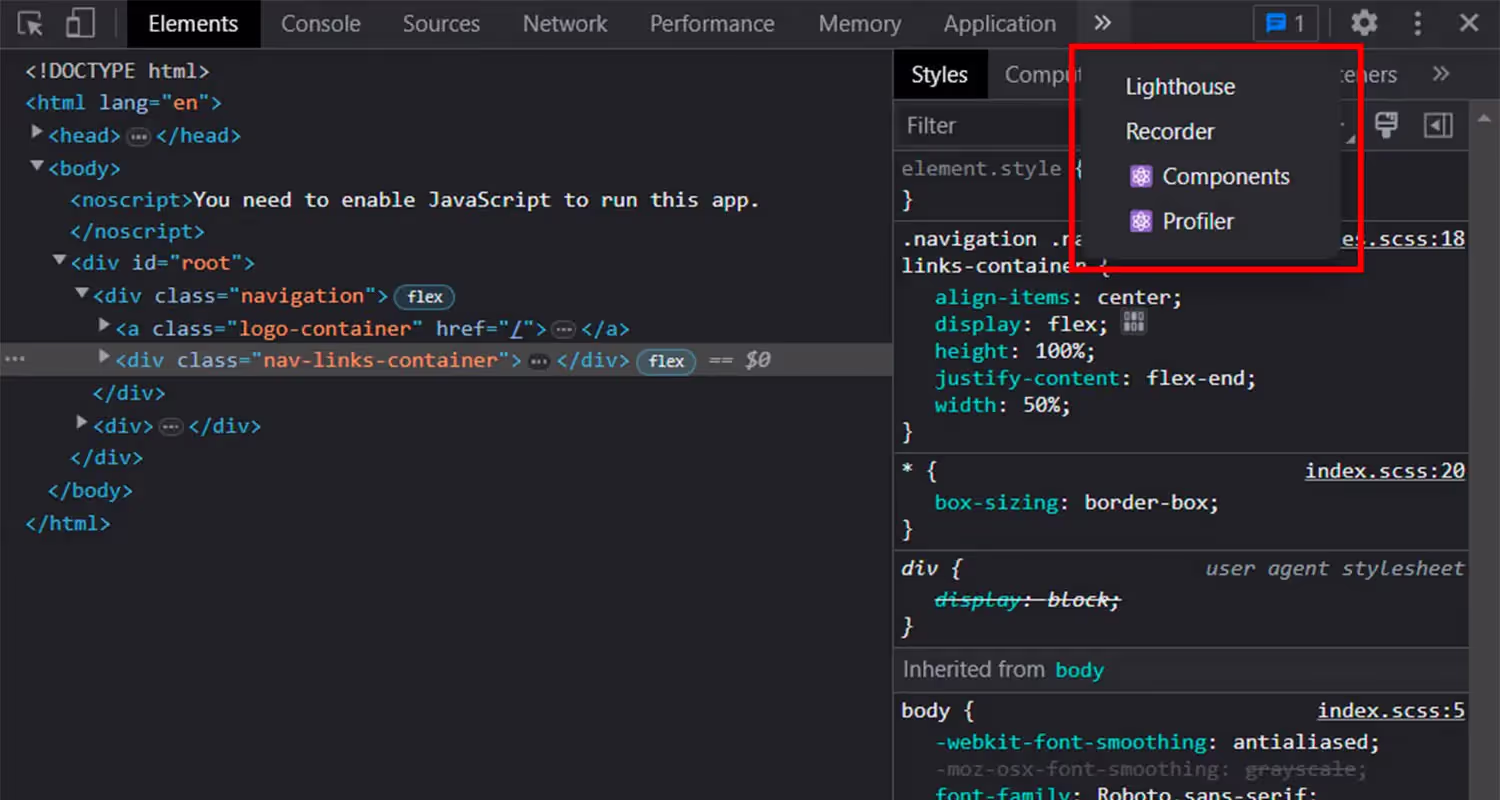
Profiler in React Dev Tools
The Profiler feature of the React Dev Tools extension helps in measuring and analyzing the performance of your React components. You can identify all the rendering bottlenecks and optimize them for better performance.
When using the Profiler in React Dev Tools, you can wrap specific parts of your component tree with the <Profiler> component from React. It allows you to measure the rendering time and interactions within that portion of the tree. This provides valuable insights into the performance characteristics of your application.
Check out this image for a visual representation of how the Profiler works and provides performance insights using React Developer Tools. By leveraging these React tools, you can ensure your application runs smoothly and efficiently, enhancing the overall user experience.

With the Profiler, you can gain insights into how components are rendering, identify components that are causing performance issues, and optimize your application's rendering performance accordingly.
Here's a table summarizing the capabilities of React devtools Profiler and Components, along with their common use cases:
To summarize - once you have used the Components feature in dev tools to inspect components in your React app and identify their properties, state, data flow, and interactions, you can move to the Profiler feature. With Profiler you can measure and analyze the rendering performance of these components.
How to use React dev tools extension with examples
In this section, let’s cover how to use React Dev Tools to inspect your React app and debug components and performance. We will use relevant examples that you can follow for your app as well.
Inspecting with React Dev Tools
We will share how you can inspect and debug performance with profiler. We will refer to this e-commerce website - https://buy-2-wear.netlify.app/ to share the steps.
To get started, you can press “Ctrl + shift + I” to go to the inspect window. From there you can monitor React Dev Tools easily.
For inspecting with React Dev Tools, you can then navigate to the panel shown below to see the component tree and view the props and state of the selected element.
When you open the “Component” tab it will show you a hierarchy tree for your React components. It also allows you to inspect the rendered DOM elements while hovering over the components.
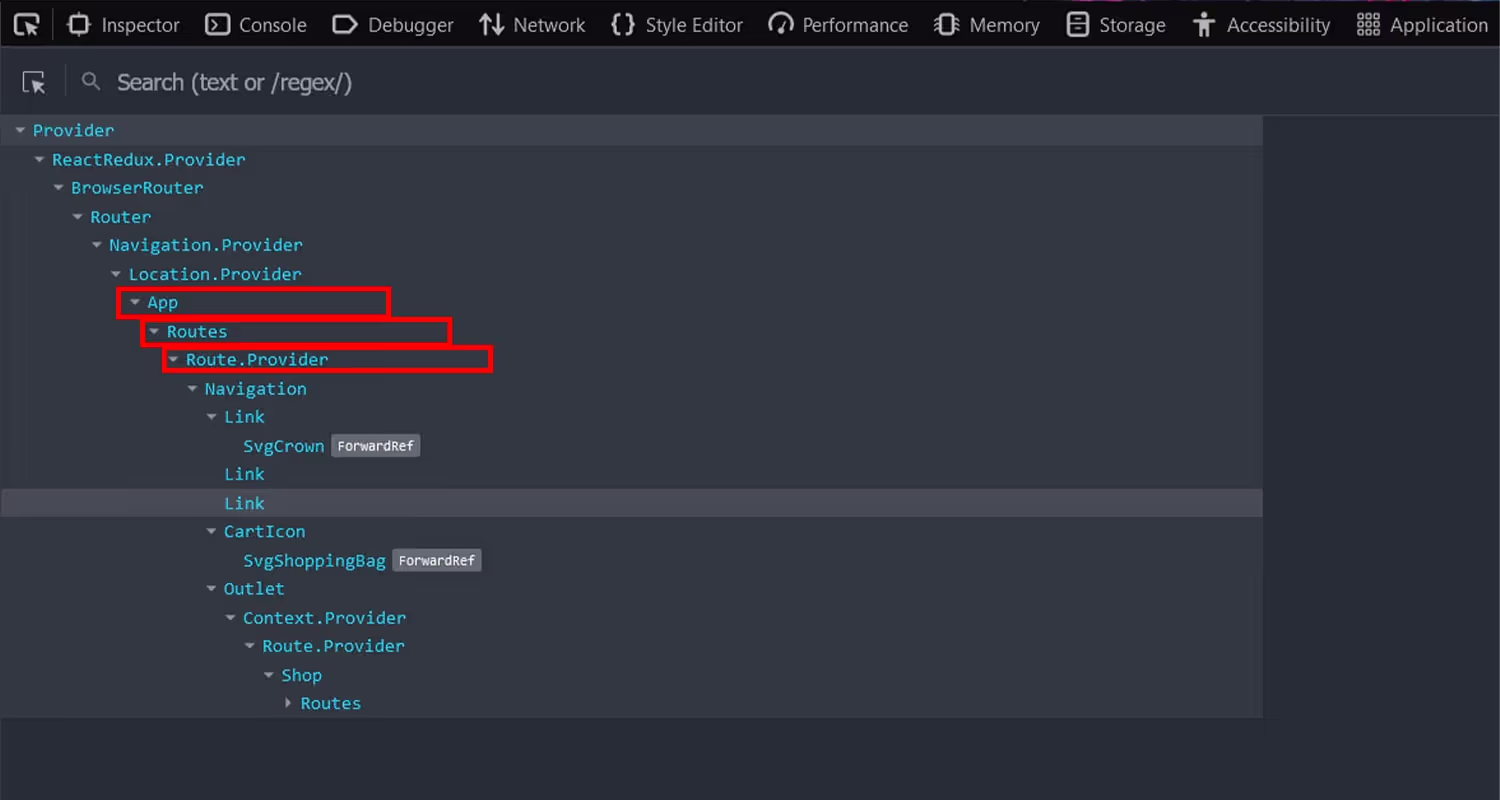
Now, if we move further in the hierarchical tree view of our App component, you will find the child component called Routes. You can expand the Routes component to see the other component nested inside it. By clicking on the Route.Provider component, you can see its props and state in the panel to the right.
Debugging performance with React Dev Tools extension
Performance debugging is an iterative process, and it's crucial to profile and test your application after each change to ensure you're moving in the right direction. With the help of the "Profiler" tab in the React Dev Tools extension, you can measure and analyze the performance of your components.
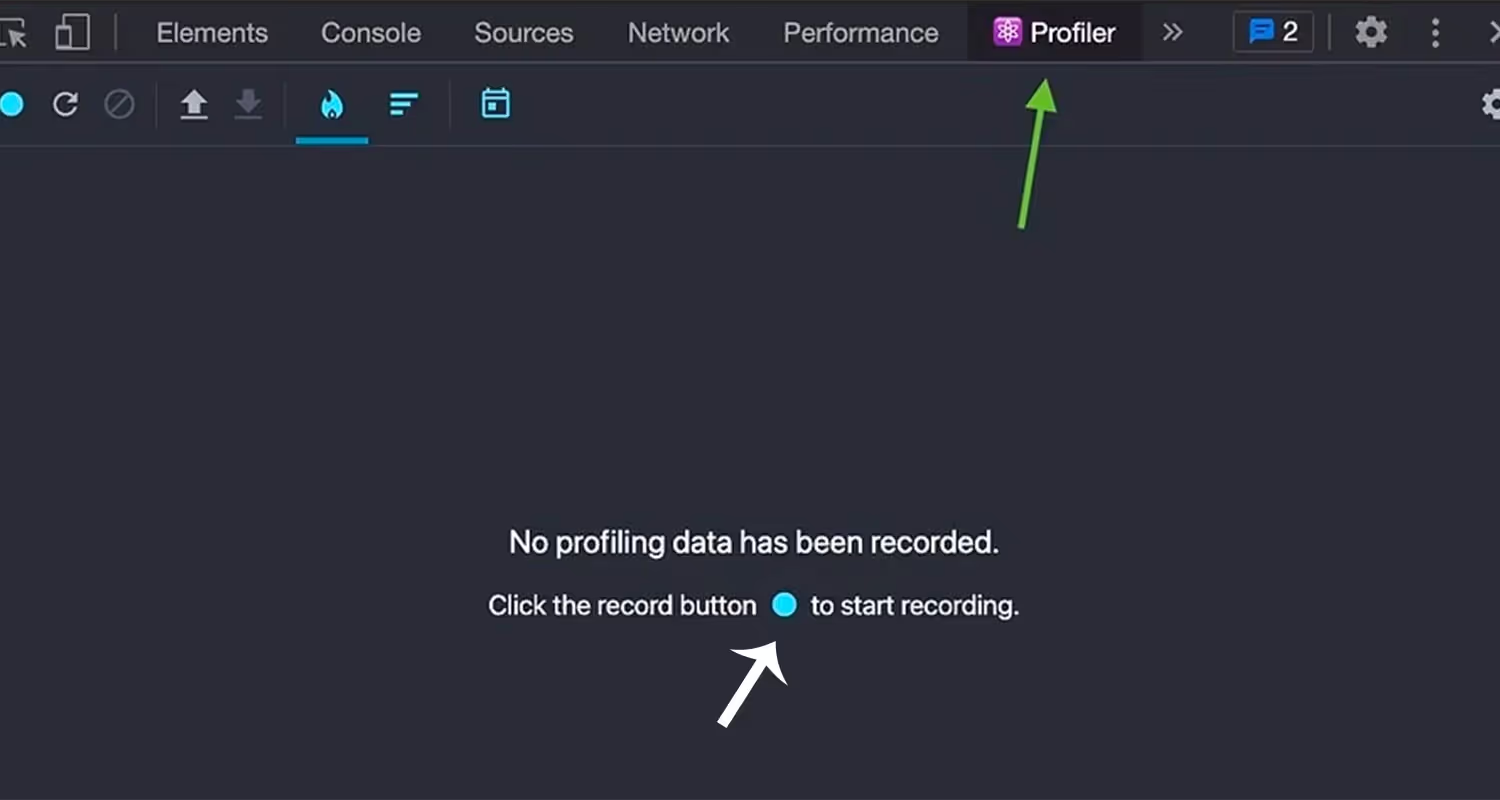
Start profiling by clicking on the "Record" button and interact with your application to capture performance data. Now, analyze the recorded data, including component render times and call stack, to identify performance bottlenecks. Here’s a profiler tab to locate the renders, re-renders, and updates over time.
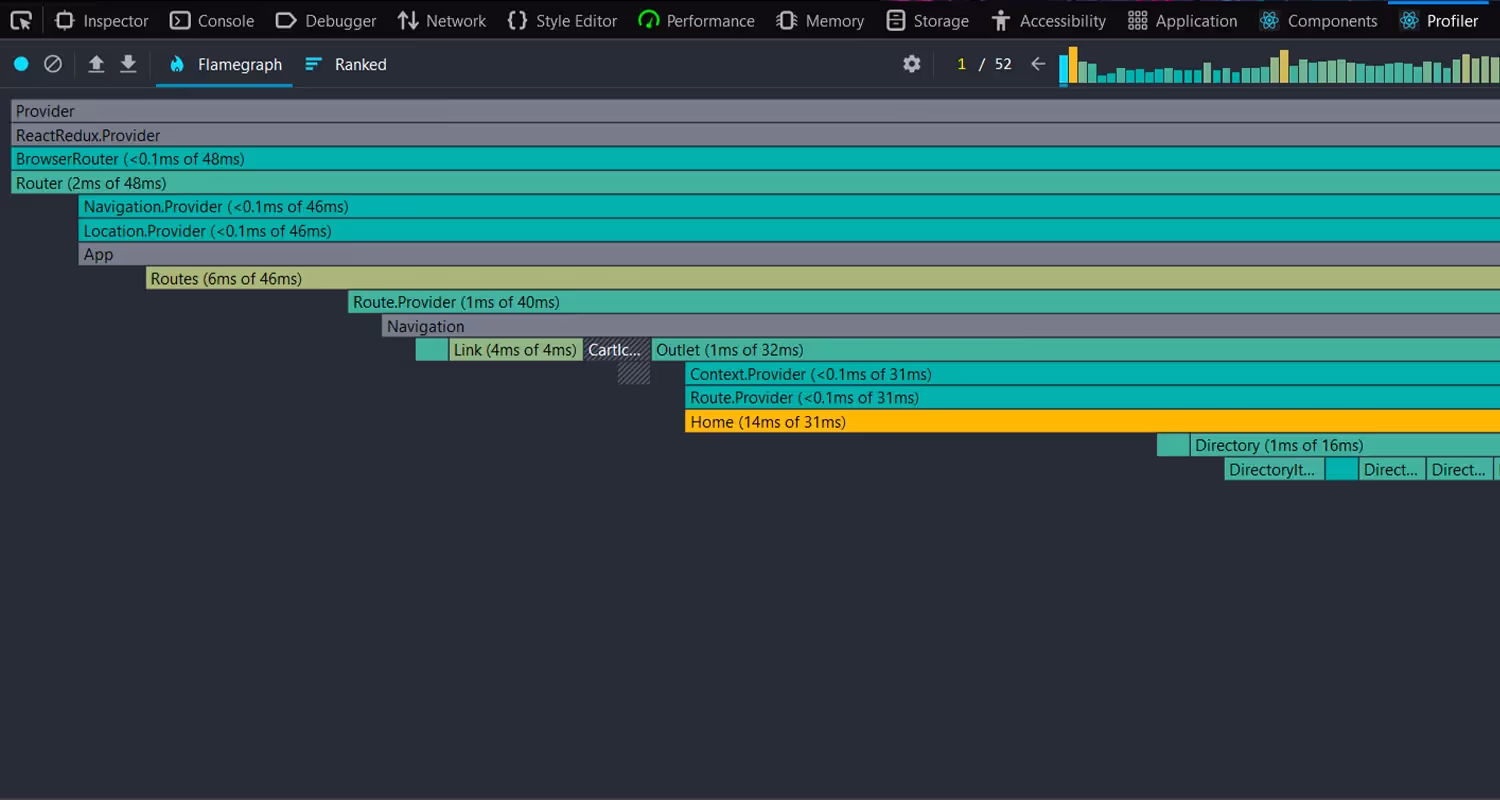
In the above image, you can clearly examine the structure of the component tree and see how they are nested and composed with each other using React Dev Tools. For example, App → LocationProvider → NavigationProvider → Router, and so on. It shows the render duration and commit timings in the commit information tab on the right side of the screen. The priorities of the components are also listed there.
Additionally, you get a Flamegraph for a visual representation of the call stack and timing information for different components. Using the Profiler in the React Devtools Extension is a good option to identify areas where unnecessary re-renders are occurring or rendering can be optimized.
By leveraging these React tools, you can ensure your application runs smoothly and efficiently, enhancing the overall user experience.
Debugging components with Dev Tools
Now, it’s time to understand how debugging is done with React dev tools. Let’s take an example of a simple React component which is not rendering properly. In this component the counter variable is incrementing by 1, every time when the setCounter function is called.
Here, the Count component is used for rendering a button and counting the value, which gets incremented when the button is clicked. However, when you run the application, you will notice that the count value isn't updating properly after you click the button.
Now, open React Dev Tools in your browser and select the “React” tab to debug this issue. From there, you can find the Count component in the component tree and inspect its props and state. If the state of the Count component isn't updating correctly when the button is clicked, then you can modify the state of the component.
For example, you could include a breakpoint in the click method and halt code execution when the breakpoint is reached. From there, you can use the console to log additional information or modify the state of the component to see if that resolves the issue.
By using these powerful React tools, you can efficiently debug and resolve issues within your React applications.
We've included a debugger statement in this example to pause code execution and observe the state of the component when the click function is called.
There are multiple ways to debug issues with React Dev Tools. Here are some:
- Use the “Hooks” tab to inspect and debug the state and effect hooks used by a component.
- Modify the props or state values to test different scenarios and observe the component’s behavior in real-time.
- Identify any incorrect or unexpected values in the component’s props or state.
Other dev tools for React
Although React Dev Tools is the most common tool for debugging and profiling React apps, there are other devtools as well that support in React development. These dev tools offer additional functionalities for debugging and optimizing your React apps. Here, are some tools worth knowing:
- Storybook - This open-source tool primarily focuses to document your components and create visual library of your app’s UI elements. Some popular add-ons are docs, actions, knobs, and viewport. Give this dev tool a try and see the ease in building and testing component yourself.
- Bit - If you want to build, share and reuse React components and other Javascript modules, then Bit is the right option for you to explore. It helps you in keeping track of changes to your components over time.
- React Styleguidist - You can use this dev tool to create and manage well-documented libraries. It allows us to automatically update style guidelines when the component changes.
There are more such React tools for developers out there, that you can explore to simplify React development, testing, and debugging.
Conclusion
React dev tools compatibility with your favorite browsers and straight forward interface, no doubt makes it so popular. And I believe, by now you must have gained a comprehensive understanding about this extension, and how you can use it for debugging and profiling your React applications. So do give it a shot.
In this blog we have also mentioned some other tools that use for your React app, but this list is long and it won’t hurt to know about them. So before you get busy with coding, check out our blog on popular React dev tools.
Happy Coding!


.webp)