.svg)


Quick Answer:
The best Android debugging tools in 2025 include Zipy for comprehensive session replay and crash tracking, Firebase Crashlytics for free real-time crash reporting, and Android Studio for official IDE debugging. Choose based on your needs: Zipy excels at user behavior analysis, Firebase integrates seamlessly with Google services, while specialized tools like Instabug offer enterprise-grade debugging at $249/month.
The mobile app industry has exploded with tremendous growth in recent years. Mobile applications have become ubiquitous and essential parts of our daily lives. As user reliance on these apps has surged, so have customer expectations for quality and performance.
Mobile apps now serve as critical tools in everyday activities. The quality of features, performance, and user experience has become paramount. When customers report issues or bugs, prompt resolution is absolutely crucial for maintaining user satisfaction and app ratings.
What Happens Without Effective Mobile Debugging Tools?
This is where effective mobile debugging tools become indispensable for development teams. Without adequate debugging tools and comprehensive logs, developers face significant challenges. Resolution time for reported issues can extend dramatically.
The solutions provided may become unstable without proper debugging insights. This leads to recurring problems and frustrated users. Poor debugging capabilities create a cycle of technical debt and customer complaints.
What Mobile Debugging Solutions Does This Guide Cover?
This comprehensive guide examines various mobile debugging tools available today. We'll explore solutions for debugging issues reported internally by QA teams. We'll also cover tools for resolving customer-reported problems in production environments.
Android market focus: Android maintains a staggering 69.44% global market share currently. Therefore, this blog primarily focuses on the best Android debugging tools and techniques available.
Which Platform-Specific Debugging Tools Will We Explore?
The following sections provide detailed coverage of debugging solutions across platforms:
- Google's Android debugging tools and development environment capabilities
- Apple's iOS debugging tools within Xcode and native development
- Cross-platform mobile debugging tools for hybrid app development
- Third-party debugging solutions for enterprise mobile applications
Ready to dive into the most effective mobile debugging tools for your development workflow!
What Are Android Debugging Tools?
Android debugging tools are essential components in the mobile development process. These tools help developers identify and fix coding errors at various stages of application creation. They assist in analyzing code structure, understanding execution flow, and resolving performance issues.
Modern debugging tools ensure smooth app performance across different devices and operating systems. Some tools run comprehensive tests to identify unexecuted code lines. Others provide detailed source maps that highlight problematic code sections for faster troubleshooting.
How Do Android Debugging Tools Identify Code Issues?
Advanced debugging solutions use multiple detection methods to locate problems efficiently. Code execution analysis: Tools run tests to check for unexecuted lines of code and unused functions. Device simulation: Simulators allow developers to see app behavior across different operating systems and hardware configurations.
Performance monitoring: Real-time analysis identifies bottlenecks and memory leaks during app execution. These comprehensive testing approaches ensure thorough code coverage and reliable app performance.
What Key Features Do Mobile Debugging Tools Provide?
Remote Debugging Capabilities
Remote debugging allows seamless connection between mobile devices and development computers. Developers can use browser developer tools to inspect and modify code, network requests, and UI elements in real-time. This feature works exceptionally well with web apps, hybrid applications, and native apps using web views.
Popular remote debugging tools include:
- Chrome DevTools for comprehensive web debugging
- Safari Web Inspector for iOS development
- Firefox Remote Debugging for cross-platform testing
Breakpoints and Watchpoints Functionality
Breakpoints: Set based on specific code lines to halt execution at critical points. Watchpoints: Set based on variables or memory addresses to monitor value changes. These debugging features help identify logic errors, detect memory leaks, and prevent data corruption issues.
Developers can implement breakpoints and watchpoints using IDEs like Android Studio, Xcode, or Visual Studio Code. Advanced debugging tools like LLDB, GDB, or WinDbg provide additional low-level debugging capabilities.
Emulators and Simulators
Emulators and simulators replicate real mobile device behavior on development computers. They enable comprehensive testing of app functionality, compatibility, and responsiveness across various platforms and device configurations. Physical devices aren't required for initial testing phases.
Advanced features include:
- Sensor simulation for location and motion testing
- Network throttling for different connection speeds
- Hardware configuration testing for various screen sizes
Popular options include Android Emulator and Genymotion for robust Android app debugging.
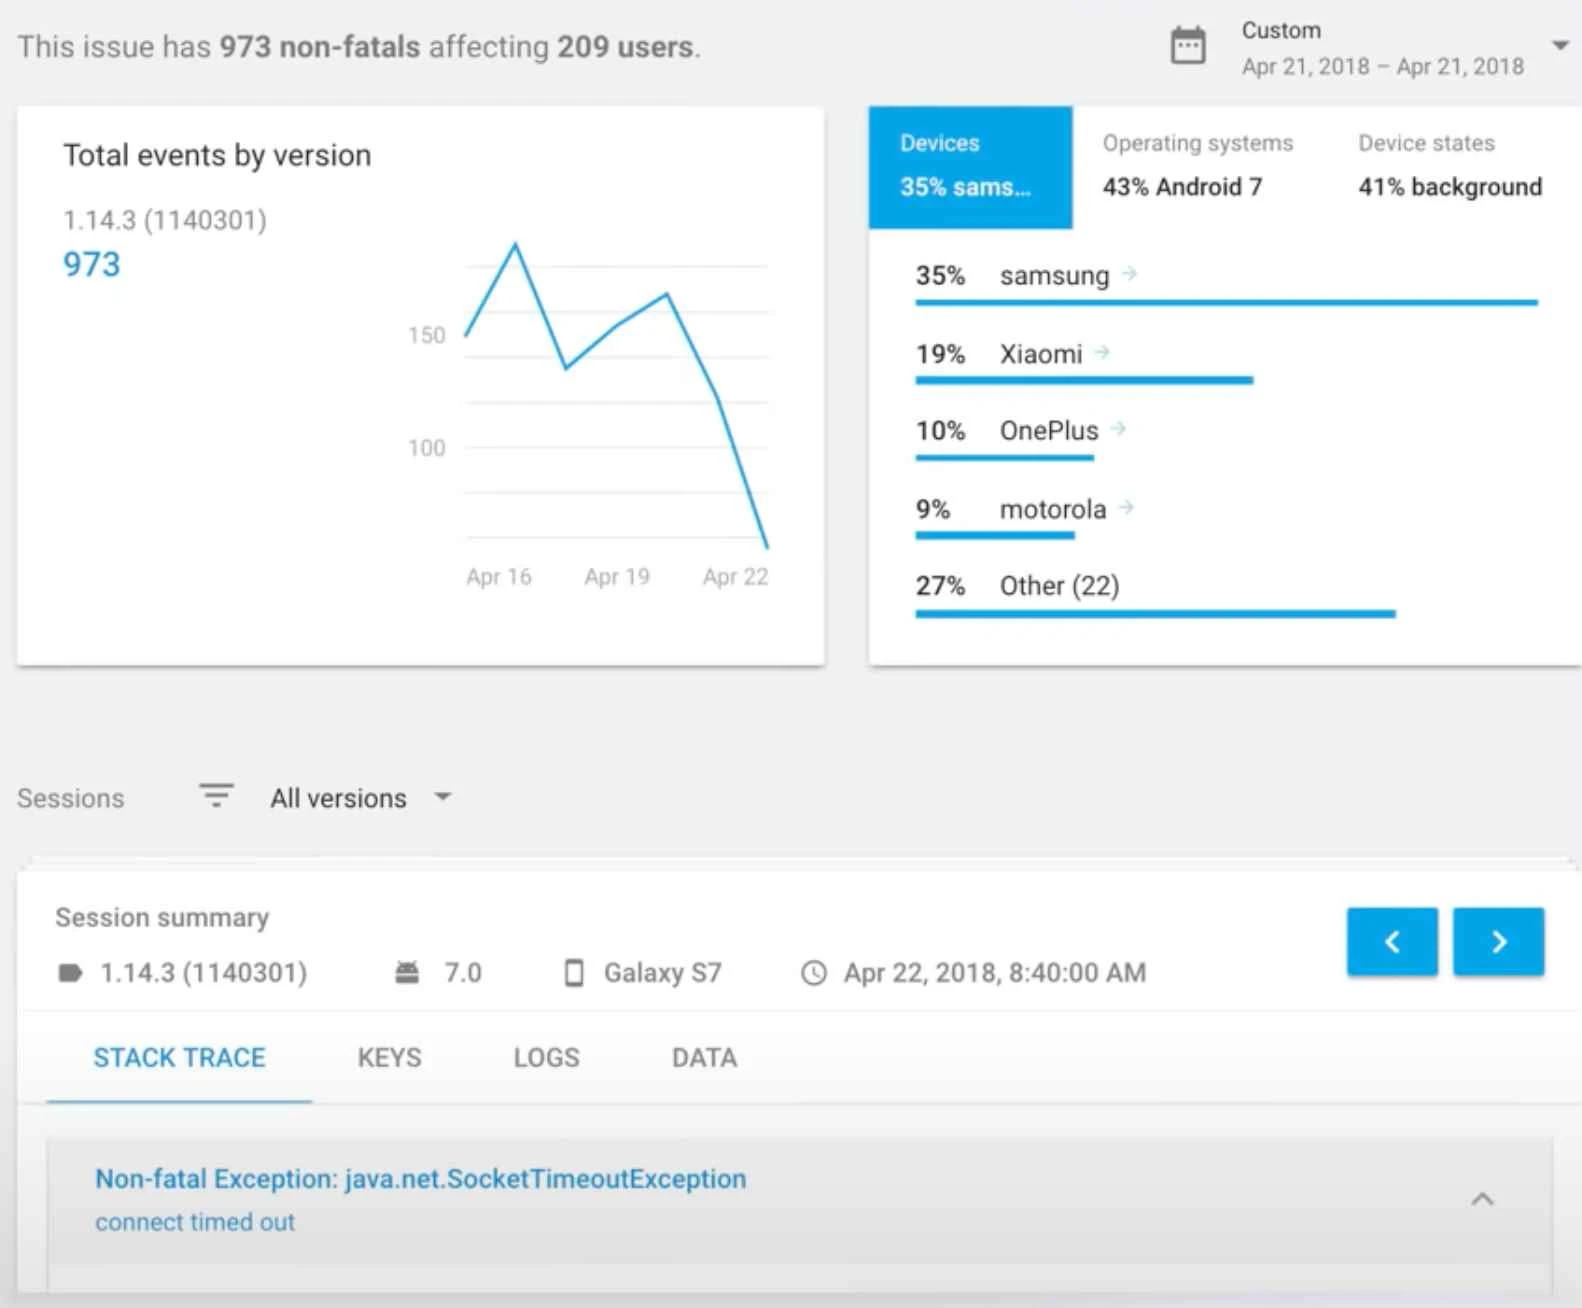
How Do Crash Reporting and Analytics Improve App Quality?
Crash reporting and analytics features gather comprehensive data about app performance, errors, and user behavior patterns. These tools help developers identify recurring issues, monitor performance trends, and improve overall app quality and usability.
Essential crash reporting data includes:
- Detailed crash logs and stack traces
- Device specifications and OS versions
- User feedback and behavior analytics
- Real-time usage statistics and performance metrics
Leading tools like Zipy, Firebase Crashlytics, and Sentry provide robust crash reporting and analytics capabilities.
What Role Do Logging and Tracing Play in Mobile Debugging?
Logging and tracing record and display messages, events, and data relevant to app execution. These features help developers track and debug code flow, application state, and UI output effectively. Network request monitoring provides additional insight into app-server communication.
Key logging features include:
- Advanced filtering and searching capabilities
- Message highlighting for critical errors
- Log export functionality for team collaboration
- Real-time trace monitoring during development
Tools like Zipy, Logcat, and Console provide comprehensive logging and tracing solutions for mobile app debugging.
How Do Testing and Automation Enhance Debugging Workflows?
Testing and automation features help developers run and verify app functionality, reliability, and security using predefined scripts and frameworks. These tools assist in bug identification, performance optimization, and maintaining high quality standards throughout development cycles.
Essential testing capabilities include:
- Unit testing for individual code components
- Integration testing for system interactions
- UI testing for user experience validation
- Load testing for performance under stress
Popular testing tools include XCTest, GitHub Actions, and Zipy for comprehensive automated testing workflows.
TL;DR Comparison Table: Top Android Debugging Tools
10 best Android debugging tools
1. Zipy
What Makes Zipy a Top Android Debugging Tool?
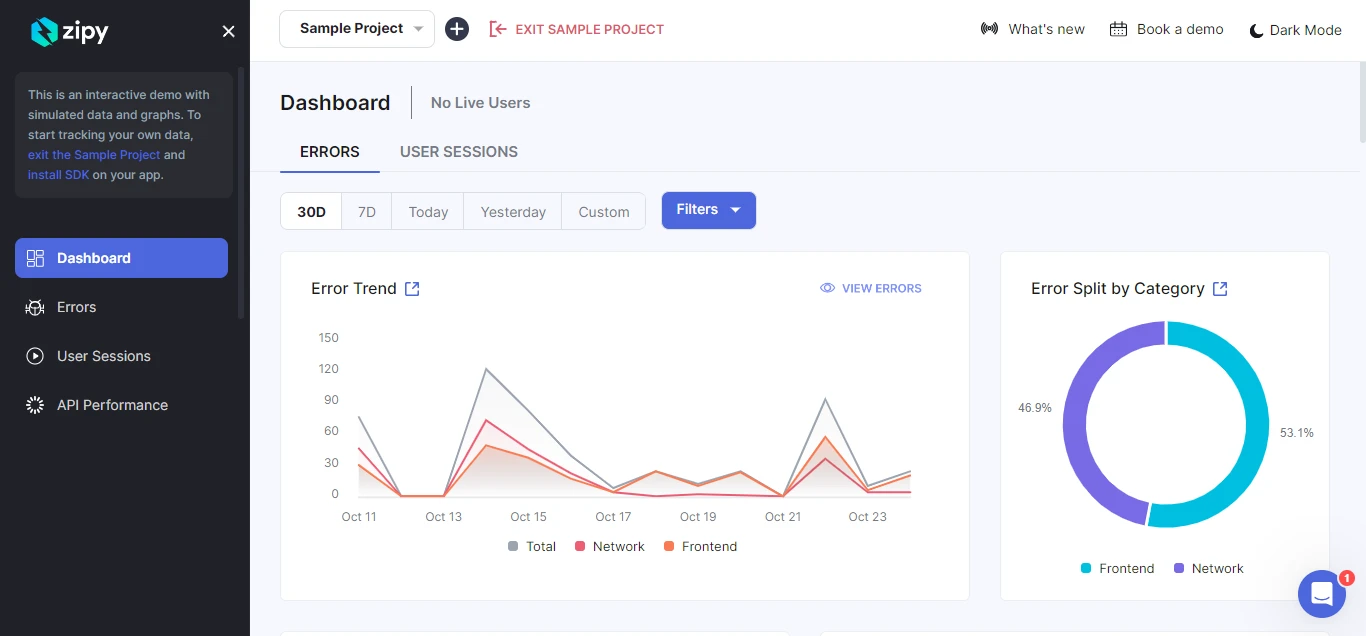
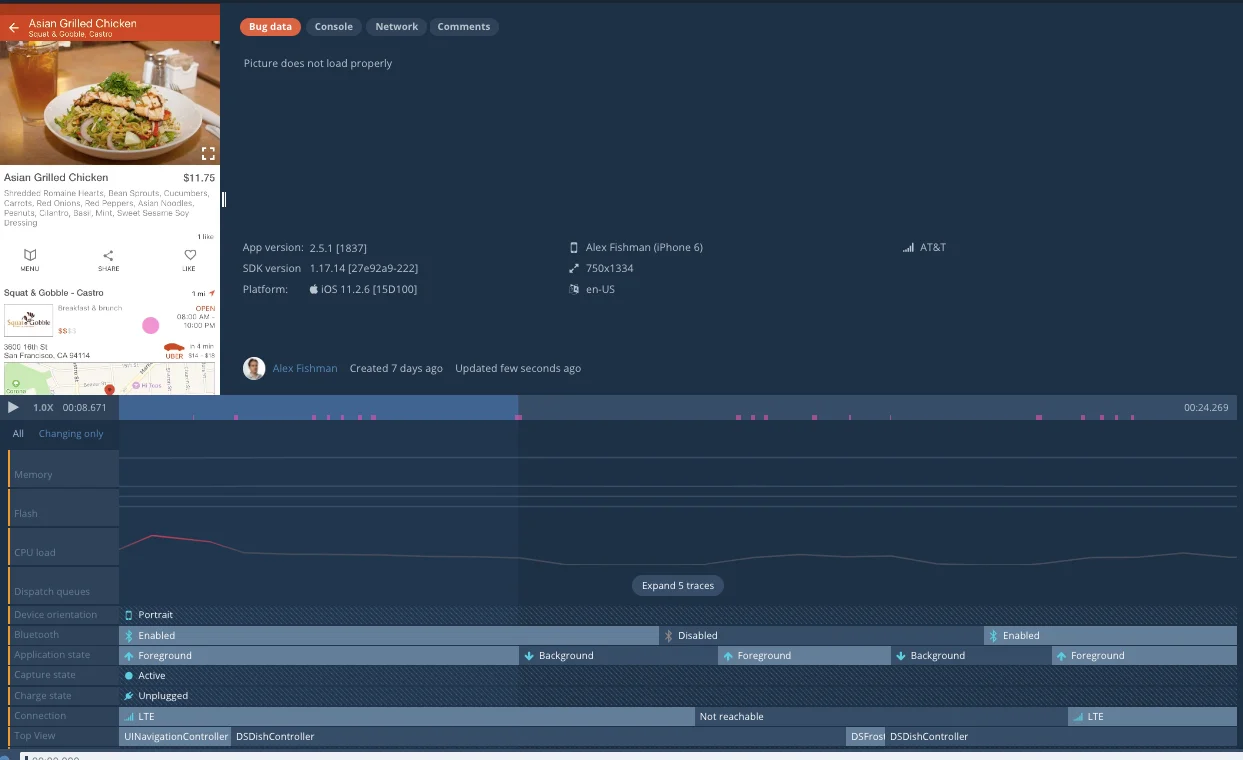
Zipy stands out as a comprehensive free debug app for Android that covers multiple development use cases. It provides extensive functionalities that enhance the end-to-end digital experience for mobile users. The platform employs real-time user monitoring, advanced error tracking, and sophisticated debugging tools.
Zipy's Android debugging dashboard provides a holistic view of user performance and error tracking. It processes and displays complete session data, listing errors and their occurrence patterns. The platform presents all debugging information in a clean graphical format for maximum developer convenience.
Which Companies Trust Zipy for Android Debugging?
Leading companies including Drivetrain, Persistent, and SurveySparrow rely on Zipy for their Android debugging needs. This widespread adoption demonstrates Zipy's acceptance as a reliable debugging tool. The platform serves as an invaluable companion for Android developers across various industries.
Enterprise credibility: Zipy's proven track record with established companies showcases its reliability for production-level Android applications.
What Core Features Does Zipy Offer for Android Debugging?
Application Crash Tracking
Zipy tracks Android application crashes through comprehensive error logs and stack trace analysis. The platform identifies crash patterns and provides detailed context about crash occurrences. Developers can quickly pinpoint problematic code sections and resolve stability issues.
Application Not Responding (ANR) Analysis
When applications become unresponsive, Zipy investigates root causes using detailed ANR logs. The tool provides insights into performance bottlenecks and threading issues. This feature helps developers optimize app responsiveness and user experience.
Console Logs Integration
DevTools integration: Console logs showcase info, debug, warning, and error messages within integrated DevTools. Seamless navigation: Developers can easily move between breadcrumbs, timeline logs, and DevTools ConsoleLogs. All logging components are interconnected for streamlined debugging workflows.
Session Replay Functionality
Session replay provides recordings of actual user interactions within Android applications. Developers can observe real-time user behavior including clicks, scrolls, and navigation patterns. This feature offers invaluable insights into user experience and interaction problems.
Real-time monitoring: Track user actions as they happen to identify usability issues and performance bottlenecks.
How Does Zipy Handle Network Monitoring and Stack Traces?
Network Logs Analysis
Zipy provides comprehensive understanding of network calls made during user sessions. The platform offers complete visibility into API requests, responses, and network-related errors. Advanced filtering features help developers search for specific API errors within the error dashboard.
Holistic network view: Complete data analysis and error tracking within network logs through integrated DevTools.
Advanced Stack Trace Debugging
Zipy expedites debugging by providing essential tools for rapid issue resolution. Precise error location: Stack traces pinpoint exact line numbers and complete function stacks within DevTools. Minified code support: Source map upload feature ensures full stack trace availability for production errors.
Intelligent error grouping: Errors are automatically grouped by identical stack traces for efficient analysis. The 'Open in DevTools' feature enables precise navigation to specific stack traces from any error.
What Advanced Features Set Zipy Apart?
Advanced Filtering Capabilities
Zipy assists developers in efficiently finding users, errors, and specific interactions within the debugging platform. Advanced search features enable easy location and analysis of user activity patterns. Developers can identify specific errors and interactions like button clicks for enhanced user behavior understanding.
Error Alert System
Proactive monitoring: Zipy offers comprehensive alerting features to keep developers ahead of potential issues. 24-hour focus: Priority alerts for new errors emerging in the last 24 hours enable prompt resolution. This prevents customer complaints and maintains app stability.
2. Firebase Crashlytics
How Does Firebase Crashlytics Compare for Android Debugging?
Firebase Crashlytics serves as a real-time crash reporting tool that automatically collects, analyzes, and organizes crash reports. It helps developers monitor app stability and understand issue prioritization. Crashlytics provides a comprehensive dashboard of all crashes with instant alerts about new problems.
Contextual crash analysis: The platform utilizes logs and key-value pairs to add context to crash stack traces. This approach helps developers understand app behavior at the time of crash occurrence.
What Makes Firebase Crashlytics Effective for Issue Resolution?
Firebase Crashlytics simplifies large numbers of crashes into concise problem lists for easier analysis. Contextual information: Highlights crash severity, frequency patterns, and provides actionable insights for stability improvements. Resource accessibility: Lists debugging resources that facilitate issue identification, analysis, and resolution.
Real-time alerting: Delivers instant notifications about new issues, resolved problems, or escalating concerns requiring immediate attention.
Pricing advantage: Firebase Crashlytics operates as a completely free debugging app for Android with seamless workflow integration.
3. ACRA
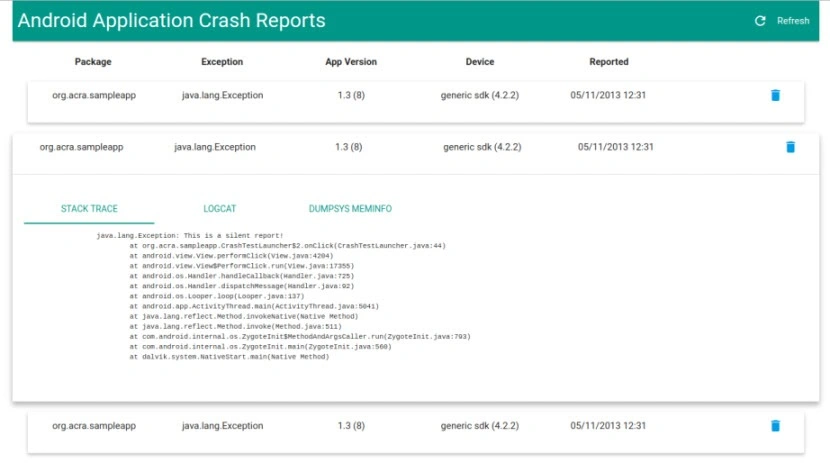
What Is ACRA and How Does It Support Android Debugging?
ACRA serves as an open-source library functioning as a debug app for Android applications. It enables automatic posting of crash reports to backend servers without manual intervention. ACRA targets Android application developers who need comprehensive data collection when apps crash or behave unexpectedly.
Open-source advantages: Due to its Apache 2.0 license, active contributor community, and extensive customization options, ACRA has become extremely popular among Android developers. The platform offers flexibility that proprietary solutions often cannot match.
How Does ACRA Handle Crash Report Configuration?
ACRA allows developers complete control over crash report uploading and processing. Custom backend integration: Reports can be configured to upload to custom backend servers or predefined email lists. Content customization: Developers can configure crash report contents and add custom traces for enhanced debugging context.
Flexible reporting: Custom traces can be captured and published with or without actual crashes occurring. This proactive approach helps developers identify potential issues before they impact users significantly.
What Makes ACRA Effective for Android Debugging Environments?
ACRA meticulously collects comprehensive information about crashes and environmental conditions during failures. Versatile delivery options: The platform can deliver crash information through multiple channels based on developer preferences. User feedback integration: Optional feedback mechanisms inform users about crash status and resolution progress.
Independence advantage: No dependencies on Google Play Store mean apps not published on Play Store can integrate ACRA seamlessly. ACRA customizes easily with existing backends like Acrium or custom solutions.
What Are ACRA's Pricing and Licensing Options?
Open-source freedom: ACRA operates as a completely free, open-source Android debugging solution. Custom implementation: Like many Android debugging tools, it offers custom pricing for enterprise implementations requiring specialized support or features.
The Apache 2.0 license ensures developers can modify, distribute, and use ACRA without licensing restrictions or ongoing costs.
4. Smartlook
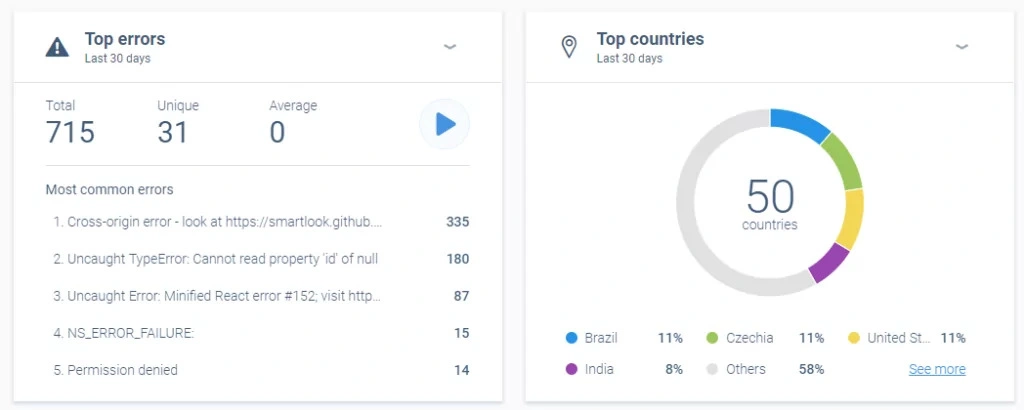
What Is Smartlook's Approach to Android Application Analytics?
Smartlook functions as a mobile debug app providing comprehensive Android application analytics for tracking and understanding customer behavior patterns. The platform generates detailed crash reports, conversion funnels, and heatmaps for thorough user experience analysis. Smartlook offers multiple screen capturing modes based on specific debugging requirements.
Adaptive capture modes: Developers can switch between native apps mode, game recording mode, or wireframe mode. Each mode targets different user behavior patterns and specific analytical requirements for optimal debugging insights.
How Does Smartlook Simplify Android App and Game Debugging?
Debugging Android applications and games presents significant challenges, but Smartlook streamlines this complex process. Session recording insights: In-depth session recordings provide comprehensive demonstrations of user interactions and problem occurrences. Developer-friendly integration: Lightweight SDK ensures easy integration with Android platforms without performance impact.
Compliance standards: SOC/GDPR/CCPA compliance ensures data protection while maintaining debugging effectiveness. Smartlook tracks all user actions and enables filtering of events to locate precise information needed for issue resolution.
What Are Smartlook's Pricing Plans for Android Debugging?
Smartlook offers flexible pricing options to accommodate different development team sizes and requirements. Free tier availability: Basic functionality available at no cost for small teams and individual developers. Paid plans: Premium features start at $55 per month for enhanced analytics and extended data retention.
Scalable pricing: Plans scale based on session volume and feature requirements for growing development teams.
5. UXCam
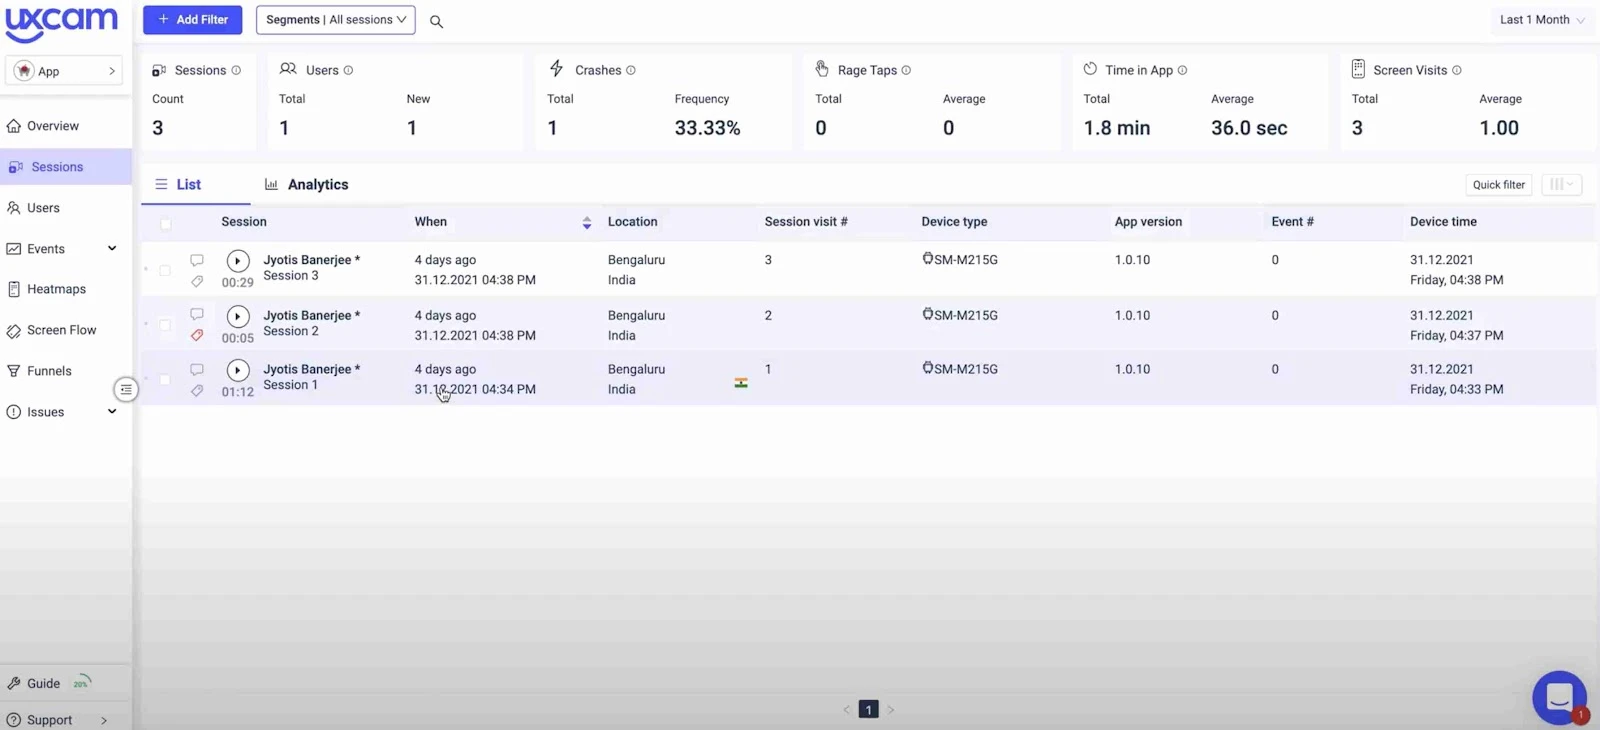
What Makes UXCam an Effective Android Debug App?
UXCam provides comprehensive analytical solutions that work across all mobile app flavors and platforms. It helps developers identify Android application usability issues, understand Key Performance Indicators (KPIs), and improve customer journey experiences. The platform supports native apps, hybrid applications, Android and iOS platforms seamlessly.
UXCam records complete application sessions and captures all key presses and user interactions within apps. Advanced monitoring: The platform tracks UI freezes, crashes, and handles exceptions with detailed analytics. UXCam provides dashboard functionality, heat maps, and screen flow analytics for thorough debugging insights.
How Does UXCam Enhance Android Application Debugging Workflows?
UXCam enables developers to define custom events, send them to personalized dashboards, and create tailored conversion funnels. Easy integration benefits: Lightweight SDK and straightforward integration make UXCam commercially viable for Android debugging applications. The platform emphasizes user-friendly design and ease of use for development teams.
Comprehensive monitoring: Through detailed logging, developers can monitor errors, crashes, and performance issues within a single unified platform. UXCam identifies bugs that might go unnoticed during development phases, providing valuable debugging process information.
What Are UXCam's Pricing Options for Android Debugging?
UXCam offers flexible pricing plans designed to accommodate different team sizes and requirements:
Available Plans:
- Free Trial Plan: No-cost option for initial evaluation and testing
- Growth Plan: Tailored for growing businesses with custom pricing structures
- Enterprise Plan: Designed for larger organizations with custom user-based pricing models
Contact requirement: For specific pricing details and custom implementations, direct team contact is recommended for accurate quotes.
6. UserExperior
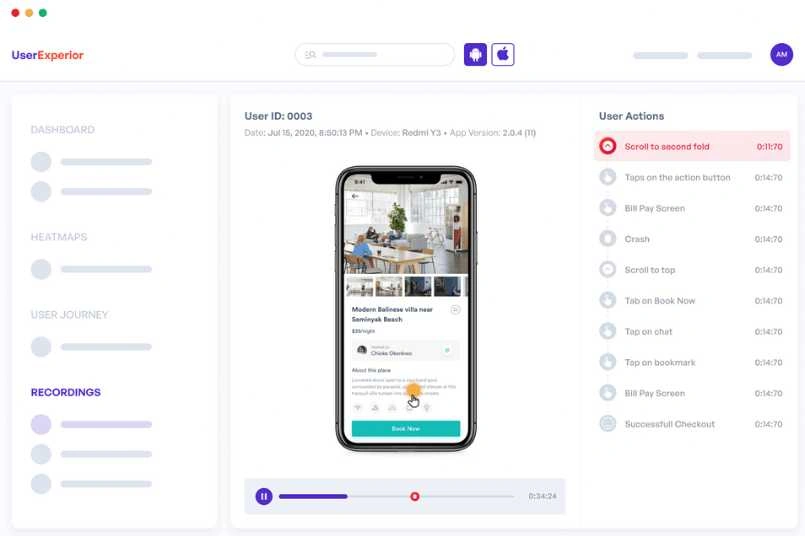
What Is UserExperior's Approach to Mobile Application Analytics?
UserExperior operates as a comprehensive mobile application analytics tool that helps developers visualize, understand, fix issues, and improve user experiences. As one of the best debugging apps for Android, UserExperior offers easy integration and supports various programming languages for Android and iOS development environments.
Session recording capabilities: UserExperior provides detailed session recordings that help visualize customer behaviors and crash occurrences. The platform captures all user interactions and screen transition information for thorough analysis.
How Does UserExperior Excel as an Android Debugging Solution?
UserExperior offers comprehensive features including heat maps and charts for understanding customer journeys effectively. Performance monitoring: Application performance tracking capabilities can be monitored and analyzed using UserExperior's integrated tools. The platform stands out through powerful third-party integrations.
Integration advantages: UserExperior integrates seamlessly with analytical tools like Firebase Crashlytics, Mixpanel, and Clevertap for enhanced functionality. Security compliance: Enterprise-grade security compliance ensures complete data protection and privacy standards.
What Makes UserExperior Effective for Android Debugging Workflows?
UserExperior streamlines collaboration with other Android debugging tools like Firebase Crashlytics for enhanced debugging capabilities. Issue replication: The platform helps replicate crash and ANR issues using detailed screen recordings for accurate problem identification.
Collaborative debugging: Integration with multiple debugging tools fosters more refined debugging processes and efficient issue resolution. As a comprehensive mobile debugging tool, UserExperior delivers excellent performance across development workflows.
What Are UserExperior's Pricing Plans for Android Debugging?
Trial availability: UserExperior provides a comprehensive 14-day free trial for complete feature evaluation. Premium options: Post-trial period includes Premium plan availability with custom pricing structures based on specific requirements.
Value proposition: Custom pricing makes UserExperior an excellent choice for developers seeking robust and reliable Android debugging applications with enterprise-level capabilities.
7. New Relic
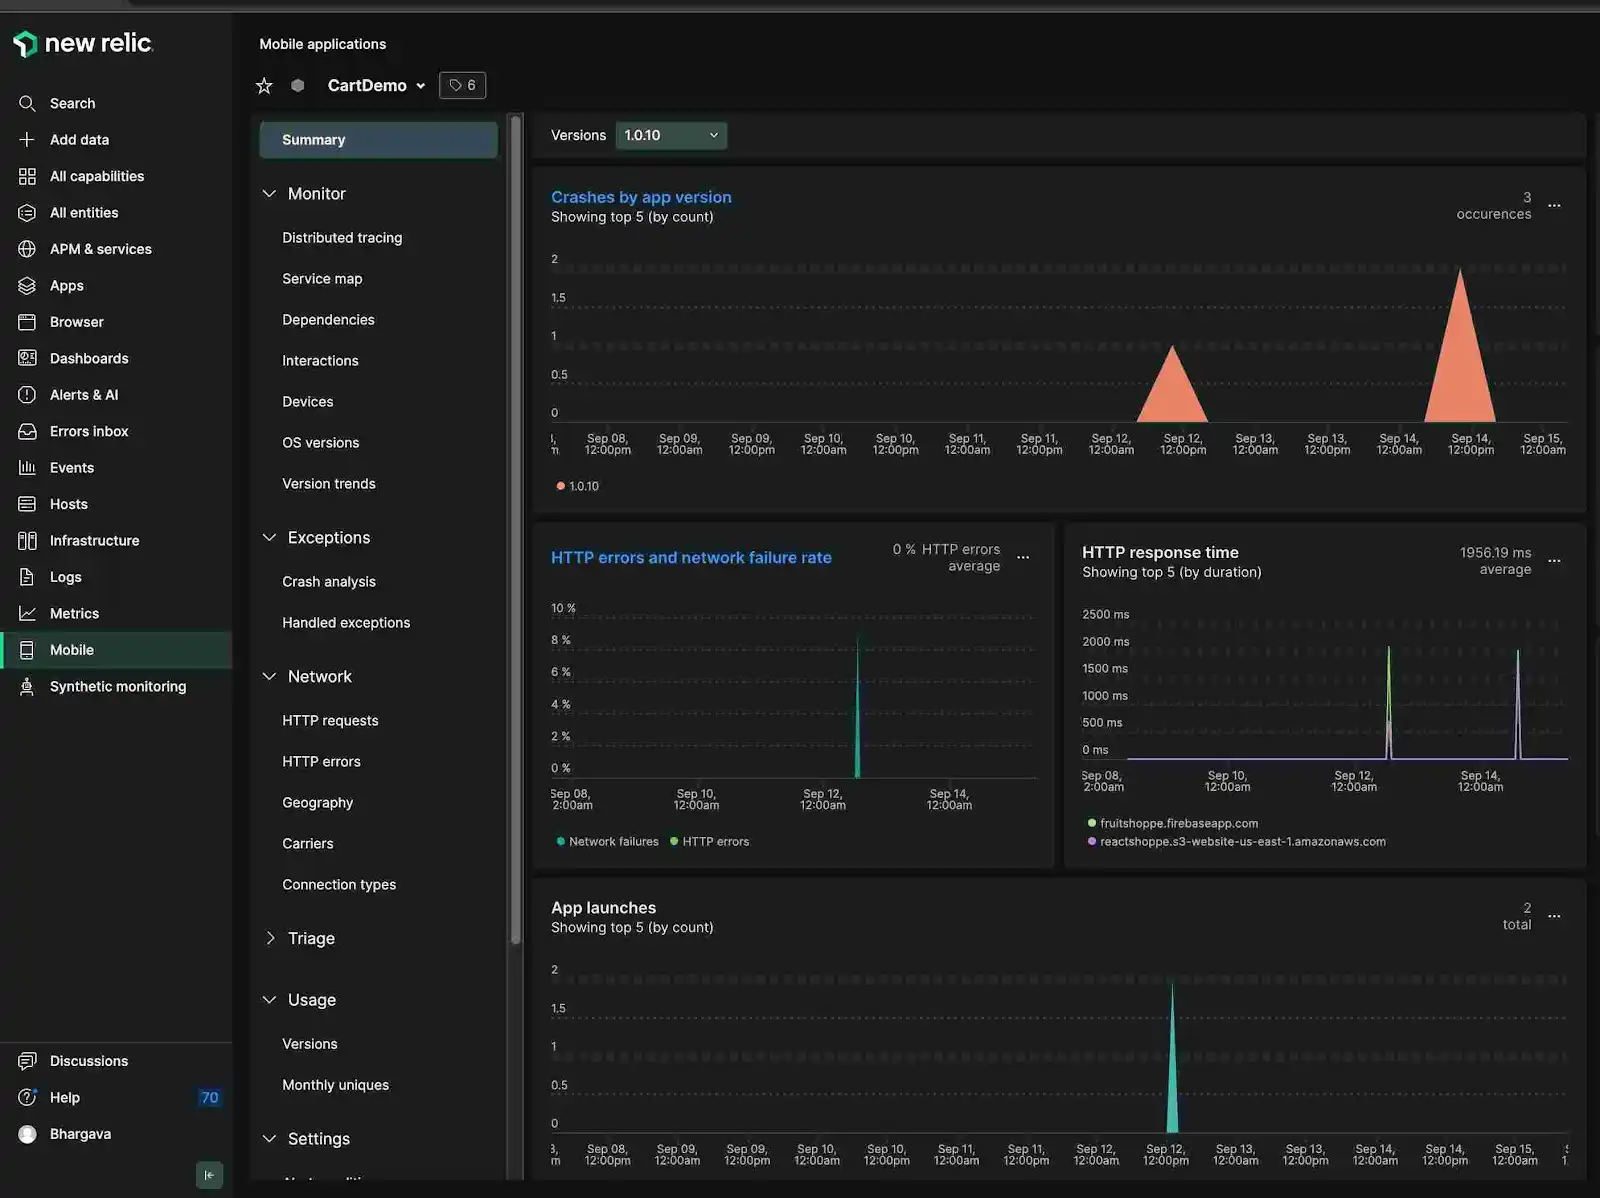
How Does New Relic Improve Android Application User Experience?
New Relic's mobile monitoring solution enhances user experience by providing comprehensive details on application crashes and stack traces. The platform handles exceptions effectively and enables custom log collection for thorough debugging analysis. New Relic captures various HTTP/network errors thrown by Android applications with detailed context.
Network error insights: New Relic provides detailed information on HTTP and network errors reported by applications. Response time tracking for each request helps identify performance bottlenecks and optimization opportunities.
What Advanced Filtering Capabilities Does New Relic Offer?
New Relic enables sophisticated error filtering based on URLs, domains, HTTP methods, and other technical parameters. Application performance tracking: The platform captures application launch times and identifies most frequently used activities or screens within Android applications.
Framework compatibility: New Relic works seamlessly with various mobile application frameworks and supports both iOS and Android platforms comprehensively. The platform offers convenience through easy integration and broad compatibility with development environments.
How Does New Relic Integrate with Other Android Debugging Tools?
Android debugging tools require seamless integration capabilities, which New Relic delivers with exceptional ease. Third-party integration: The platform offers robust integration with popular Android debugging tools like Jira for enhanced workflow management. Easy integration reduces development complexity and improves debugging efficiency across teams.
Workflow optimization: Integration capabilities enable developers to maintain existing workflows while adding powerful monitoring and debugging features.
What Are New Relic's Pricing Plans for Mobile Monitoring?
New Relic offers flexible pricing options to accommodate different development team requirements and budgets:
Available Plans:
- Free Plan: Basic monitoring capabilities at no cost
- Standard Plan: Enhanced features with custom pricing options
- Pro Plan: Advanced functionality with custom pricing structures
- Enterprise Plan: Full-featured solution with custom enterprise pricing
Custom pricing: The latter three plans feature custom pricing options tailored to specific organizational needs and usage requirements.
8. Instabug
What Makes Instabug a Powerful Android Debug App?
Instabug empowers mobile teams to achieve perfect balance between stability, performance, and feature development throughout app lifecycles. This debugging app for Android builds on a lightweight SDK foundation, providing unique insights for mobile teams. Teams can align with key performance indicators and identify issues before escalation occurs.
Enterprise-grade platform: Instabug offers enterprise-level capabilities with easy access to vital debugging information including screenshots, network logs, and comprehensive device details. This information proves crucial for rapid issue resolution and effective product backlog prioritization.
How Does Instabug Go Beyond Basic Android Debugging?
Instabug transcends traditional debugging app functionality through its powerful, lightweight SDK providing unparalleled performance insights. Proactive crash resolution: The platform identifies and resolves crashes before they impact end users significantly. Detailed crash reports include contextual information like device logs, network requests, and screenshots.
Root cause identification: Contextual crash data helps developers pinpoint problems swiftly and implement stable solutions for long-term app reliability.
What Key Benefits Does Instabug Provide for Android Development?
App Stability and Performance Improvement
Instabug provides comprehensive understanding of app performance through detailed metrics and analytics. Optimization identification: The platform helps developers identify specific areas requiring performance optimization and stability enhancements.
Streamlined Bug Reporting and Resolution
User-friendly reporting: Instabug enables effortless bug reporting with annotated screenshots, screen recordings, and detailed descriptions directly from within applications. In-app functionality: Users can report issues without leaving the app environment, improving feedback quality and response rates.
Effective Issue Prioritization
Critical data access: Developers gain access to essential information including device details, network logs, and user interaction steps. Faster resolution: Priority-based bug categorization enables teams to resolve critical issues faster and maintain app stability.
What Are Instabug's Pricing Options for Android Debugging?
Free trial availability: Instabug provides a comprehensive 14-day free debugging experience for Android applications. This trial period allows teams to explore all comprehensive features without financial commitment.
Flexible pricing plans: Beyond the trial period, Instabug offers scalable pricing plans starting at $249 per month. Enterprise solutions: Custom pricing options are available for enterprise-grade implementations requiring specialized features and support levels.
9. Eclipse

What Makes Eclipse a Valuable Java-Based Android Debugging Tool?
Eclipse operates as a comprehensive Java-integrated development environment that streamlines effective software project management. The platform combines IDE features with project management capabilities, making it suitable for development teams. Teams can develop software from initial concept through final release using standardized tools and established processes.
Legacy support consideration: While Google no longer officially supports Eclipse for Android development, it remains a highly demanded tool among developers. Eclipse's continued popularity stems from seamless collaboration capabilities with multiple programming languages and robust development features.
What Key Features Make Eclipse Effective for Android Debugging?
Eclipse provides users with powerful features that enable application advancement and optimization throughout development cycles. Essential debugging capabilities include:
- Automated error reporting: Streamlined error detection and reporting processes
- Module distribution: Efficient code organization and deployment management
- Intensive development environment: Comprehensive coding and debugging tools
- Multi-language support: Seamless integration with various programming languages
Versatility advantage: These comprehensive features establish Eclipse as an incredibly versatile Android debugging tool for diverse development requirements.
What Are Eclipse's Pricing and Licensing Options?
Open-source advantage: Eclipse operates as completely free-to-use open-source software and mobile app debugging tool. No licensing costs: Developers can access all core functionality without subscription fees or usage limitations.
The open-source nature enables customization and community-driven improvements, making Eclipse accessible for individual developers and enterprise teams alike.
10. Bugsee
How Does Bugsee Simplify Bug and Crash Reporting?
Bugsee serves as a comprehensive bug and crash reporting tool for iOS and Android applications. The platform effectively eliminates communication stress with users, beta testers, and QA teams during bug reporting processes. Teams can now fully understand user expectations and issue context when bugs are filed through streamlined reporting.
Rapid reporting capability: Bug reporting now occurs within mere seconds using Bugsee's streamlined interface and automated data collection processes.
What Makes Bugsee's System Monitoring Approach Unique?
Bugsee constantly monitors and records the current system state during application usage. One-click reporting: When bugs are detected or observed, users need only one button click or device shake to initiate comprehensive data packaging. The platform automatically fills all necessary information into preferred bug tracking systems.
Comprehensive data collection: This automated approach ensures complete context capture without requiring manual user input or technical knowledge from reporters.
What Developer Insights Does Bugsee's Dashboard Provide?
Developers receive comprehensive dashboards containing complete application video recordings showing exact user interactions during bug occurrences. Essential debugging data includes:
- Video recordings: Complete application usage sessions leading to bug discovery
- Build and system information: Technical specifications and version details
- Console logs: Detailed application execution and error messages
- Network logs: API requests, responses, and connection issues
- System events: Operating system interactions and background processes
Visual debugging advantage: Video recordings provide invaluable visual context that traditional logging methods cannot capture effectively.
What Are Bugsee's Pricing Plans for Mobile Debugging?
Free tier availability: Bugsee operates as a free-to-use mobile debugging tool for teams with up to five development tools. Pro plan scaling: Beyond five tools, the Pro plan costs $99 per month and supports maximum usage of fifty development tools.
Custom enterprise options: A custom plan provides expanded feature pools and enterprise-level capabilities for larger development organizations requiring specialized functionality.
How Do Other Mobile Debugging Tools Compare?
Additional market options: Many commercially available mobile debugging and monitoring tools like Fullstory and Sentry offer standard mobile debugging functionalities. Trial availability: Most debugging tools provide free trial periods enabling teams to evaluate features and choose plans based on individual needs and preferences.
This variety ensures developers can select tools that align with specific project requirements and budget constraints.
Application development environments for mobile debugging
Android Studio
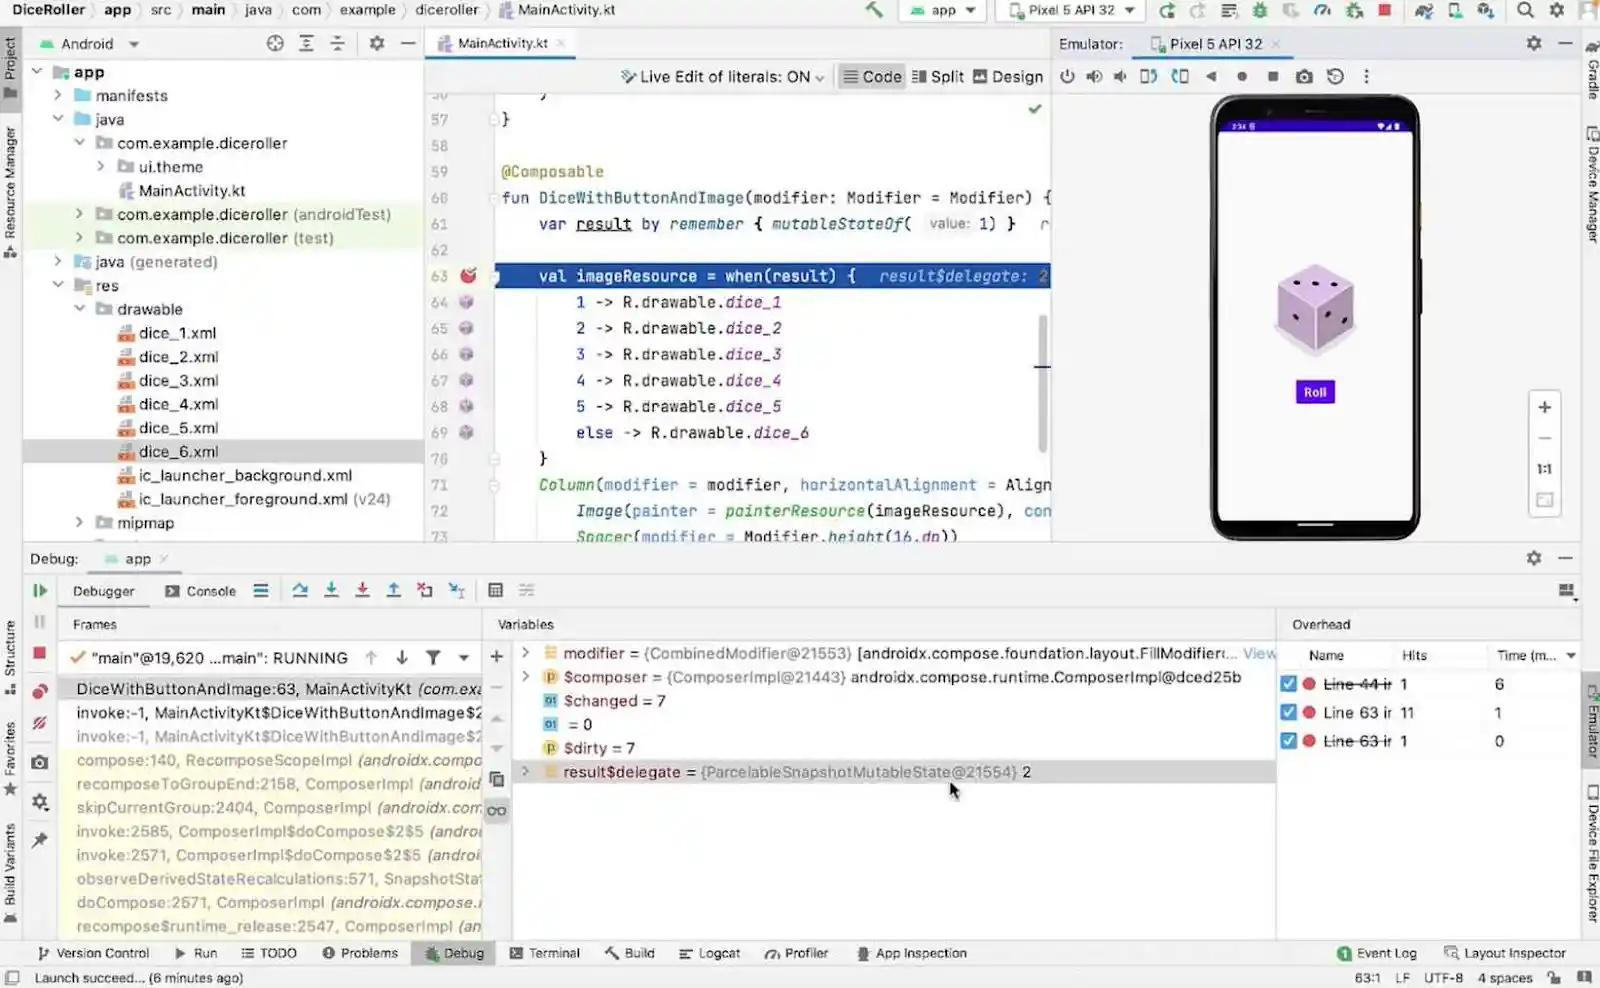
What Is Android Studio and How Does It Support Mobile Debugging?
Android Studio serves as the official integrated development environment (IDE) for developing and debugging Android applications. The platform supports various programming languages including Java, Kotlin, C++, React-native, Flutter, and many other development languages. Android Studio enables debugging of applications running on either simulators or physical devices.
Official IDE advantage: As Google's official development environment, Android Studio provides comprehensive debugging capabilities tailored specifically for Android application development and optimization.
What Advanced Debugging Capabilities Does Android Studio Provide?
Android Studio enables developers to set breakpoints throughout applications, view and modify contexts when breakpoints activate, and examine stack traces with detailed system logs. Essential debugging features include:
- UI debugging: Layout inspectors and validators for interface troubleshooting
- Network inspection: Network inspector for monitoring traffic and API calls
- Database inspection: Database inspectors for data analysis and optimization
- File management: Device file exploration with File Explorer functionality
- Documentation tools: Screenshot capture and video recording capabilities
- Bug reporting: Comprehensive bug report capture and analysis tools
Performance profiling: Android Studio provides real-time data on CPU, memory, network, and battery resource usage for comprehensive app optimization.
When Is Android Studio Most Effective for Application Debugging?
Android Studio proves invaluable for debugging applications before publication or customer release phases. Pre-release debugging: The platform excels at addressing issues reported in-house during development cycles. Testing support: Android Studio provides excellent assistance for debugging issues discovered during comprehensive testing processes.
The IDE's strength lies in controlled development environments where developers have full access to source code and testing configurations.
What Is Xcode and How Does It Support iOS Application Debugging?
Xcode operates as Apple's official IDE for developing and debugging iOS applications across Apple's ecosystem. The platform supports various programming languages including Swift, Objective-C, Java, Apple Script, React-native, Flutter, and numerous other development languages. Xcode enables application debugging on both simulators and physical iOS devices.
Apple ecosystem integration: Xcode provides seamless integration with Apple's development tools and frameworks for comprehensive iOS debugging workflows.
What Comprehensive Debugging Features Does Xcode Offer Developers?
Xcode provides extensive debugging functionality designed specifically for iOS development environments. Core debugging capabilities include:
- Breakpoint management: Setting up and managing breakpoints throughout application code
- Context modification: Viewing and modifying application context when breakpoints activate
- UI debugging reports: Specialized debugger reports for resolving user interface issues
- Memory analysis: Debug memory graph functionality for identifying and resolving memory leaks
- Location simulation: Simulate location changes for testing location-based features
- Process monitoring: Comprehensive process/thread context information analysis
- Network traffic inspection: Complete network monitoring and device-specific information access
- Performance profiling: Application performance analysis and optimization tools
When Should You Use Xcode for iOS Application Debugging?
Xcode proves most valuable for debugging applications before publication or customer release to app stores. In-house debugging: The platform excels at resolving issues reported during internal development and testing phases. Pre-release optimization: Xcode provides comprehensive tools for issues discovered during thorough testing processes.
Like Android Studio, Xcode's effectiveness peaks in controlled development environments with complete source code access.
How Should You Select the Best Android Debugging Tool?
Understanding your specific requirements from Android debugging tools is crucial for making informed selection decisions. Clear requirement analysis: Once you gain clear understanding of your debugging needs, choosing from the extensive pool of mobile debugging tools becomes significantly easier.
Feature evaluation approach: Systematic evaluation of debugging tool features ensures alignment with your development workflow and project requirements.
What Platform Compatibility Factors Should You Consider?
Android version compatibility: Debugging tools must align with your target Android version requirements since different versions utilize different APIs and features. Version-specific limitations: Incompatible debugging tools cannot effectively debug applications built for specific Android versions you're targeting.
API support requirements: Ensure debugging tools support the specific Android APIs and frameworks your application utilizes for optimal debugging effectiveness.
What Development Approach Considerations Matter for Tool Selection?
Open Source vs Proprietary Solutions
Open-source advantages: Free availability and modification capabilities make open-source tools attractive for budget-conscious teams. Specialized features: Open-source tools may offer unique features unavailable in commercial proprietary solutions.
Proprietary benefits: Licensed commercial tools often provide better maintenance, support, and documentation compared to open-source alternatives.
User-Friendliness and Technical Requirements
Skill level alignment: Choose debugging tools appropriate for your team's technical expertise and experience levels. Complexity considerations: Some tools require extensive technical knowledge while others prioritize ease of use and intuitive interfaces.
What Performance and Security Considerations Are Important?
Performance Impact Assessment
Debugging overhead: Ensure debugging tools don't significantly impact application performance during debugging sessions. Resource consumption: Some debugging tools may introduce noticeable performance overhead affecting development efficiency.
Security and Privacy Requirements
Data protection: Consider security implications of debugging tools that collect personal data or access sensitive information. Reputation evaluation: Choose tools with strong security reputations and proven privacy protection practices.
Enterprise compliance: Ensure debugging tools meet organizational security standards and regulatory compliance requirements.
Read our comprehensive guide on android debugging for more insights.
What Additional Selection Criteria Should Guide Your Decision?
Feature Requirements and Compatibility
Essential functionality: Evaluate needs for real-time monitoring, stack trace viewing, memory profiling, CPU analysis, and remote debugging capabilities. Third-party integration: Ensure compatibility with libraries and frameworks your application utilizes.
Support and Cost Considerations
Community support: Choose tools with strong developer community support including documentation, tutorials, and active forums. Budget alignment: Android debugging tools range from free to thousands of dollars, requiring careful budget consideration.
Long-term viability: Consider ongoing support, updates, and feature development when selecting debugging solutions.
What Role Do Developer Options Play in Android Debugging?
Android's Settings app includes Developer Options that configure system behaviors for performance profiling and debugging. Essential debugging capabilities through Developer Options:
- USB debugging: Enable debugging over USB connections for device testing
- Bug report capture: Comprehensive system bug report generation and analysis
- Bluetooth monitoring: HCI snoop logs for Bluetooth communication debugging
- UI analysis: Layout bounds tracking for interface optimization
- Performance monitoring: Window animation scales for device performance evaluation
- App monitoring: Performance-related attribute tracking across different device configurations
Comprehensive testing: Running applications with Developer Options across various device configurations provides complete performance visibility.
Why Is Post-Release App Monitoring Crucial for Success?
Once applications publish to app stores or release to customers, stability monitoring becomes absolutely critical for success. Customer experience impact: Buggy and unstable applications result in unhappy customers, negative reviews, and increased uninstall rates.
Real-time monitoring necessity: Monitoring applications in real-time as customers use them ensures positive user experiences and maintains app store ratings.
Customer-Reported Issue Challenges
Resolution complexity: Customer-reported issues prove challenging to resolve without proper logs and comprehensive debugging tools. Environmental context: Developers often struggle understanding specific environments where customers encounter problems.
Debugging tool importance: Robust debugging tools and detailed logs remain vital for effective troubleshooting and maintaining application stability in production environments.
FAQ Section
Q: What is the best free Android debugging tool for beginners?
Firebase Crashlytics stands out as the best free Android debugging tool for beginners due to its seamless Google integration and automatic crash reporting capabilities. The platform requires minimal setup and provides instant alerts about new issues with contextual information about crash severity and frequency. For developers just starting with Android debugging, Firebase Crashlytics offers comprehensive crash analysis without complex configuration requirements. The tool integrates directly with existing Firebase projects and provides real-time monitoring without any cost limitations, making it ideal for individual developers and small teams learning debugging fundamentals.
Q: Which Android debugging tool offers the most comprehensive user behavior analytics?
Zipy provides the most comprehensive user behavior analytics among Android debugging tools, featuring session replay, heatmaps, user journey analysis, and real-time error monitoring in a single platform. Unlike basic crash reporting tools, Zipy captures complete user sessions showing exactly how users interact with your app before issues occur. The platform combines crash tracking with user behavior insights, enabling developers to understand not just what went wrong, but why it happened from a user experience perspective. With features like stack traces, network logs, and advanced filtering capabilities, Zipy offers unmatched visibility into both technical errors and user interaction patterns for thorough debugging analysis.
Q: How do I choose between open-source and proprietary Android debugging tools?
Choose open-source tools like ACRA when you need customizable crash reporting with full control over data handling and backend integration, especially for apps not published on Google Play Store. Open-source solutions offer cost advantages and flexibility for teams with technical expertise to customize implementations. Select proprietary tools like Zipy or Instabug when you need comprehensive support, regular updates, and advanced features like session replay or AI-powered insights. Proprietary tools typically provide better documentation, customer support, and integration capabilities with other development tools. Consider your budget, technical requirements, customization needs, and long-term maintenance capabilities when making this decision for optimal debugging workflow efficiency.
Q: What debugging tools work best for enterprise Android applications?
Instabug and New Relic excel for enterprise Android applications due to their comprehensive monitoring capabilities and enterprise-grade security compliance. Instabug offers robust crash reporting with detailed contextual information starting at $249/month, while New Relic provides infrastructure monitoring with advanced analytics and custom enterprise pricing. Both tools offer extensive integration capabilities with existing enterprise development workflows, team collaboration features, and priority support options. Enterprise teams should also consider Zipy's Enterprise plan for custom volume handling and advanced debugging features. These tools provide scalability, security compliance, and comprehensive reporting required for large-scale Android application deployments in enterprise environments.
Q: Do I need different debugging tools for development versus production environments?
Yes, you typically need different debugging approaches for development and production environments to maximize efficiency and user privacy. For development, use Android Studio or Xcode for comprehensive breakpoint debugging, code inspection, and performance profiling with full access to source code and system logs. For production environments, implement tools like Zipy, Firebase Crashlytics, or Instabug that focus on crash reporting, user session monitoring, and real-time error tracking without exposing sensitive debugging information. Production debugging tools prioritize user privacy, data security, and lightweight monitoring that doesn't impact app performance. Many successful development teams use Android Studio during development phases and transition to specialized production monitoring tools like Zipy for post-release debugging and user experience optimization.


.webp)