.svg)


The information about network requests made by the client and server inside the browser is contained in HAR files, also known as HTTP Archive files. These files have the extension but are formatted in JSON.harThe HAR file, which includes all the information about the resources being processed between the browser and the server, is mostly used to analyse issues with request and response performance, sluggish API calls, page rendering, or load times.
HAR file details
HAR file format is JSON structure and to visualize its content we can use tools like HAR Viewer or network viewer
To analyze the performance of the site, we can export the HAR files, steps are as below:
1.First, we need to open a network tab in Chrome DevTools:
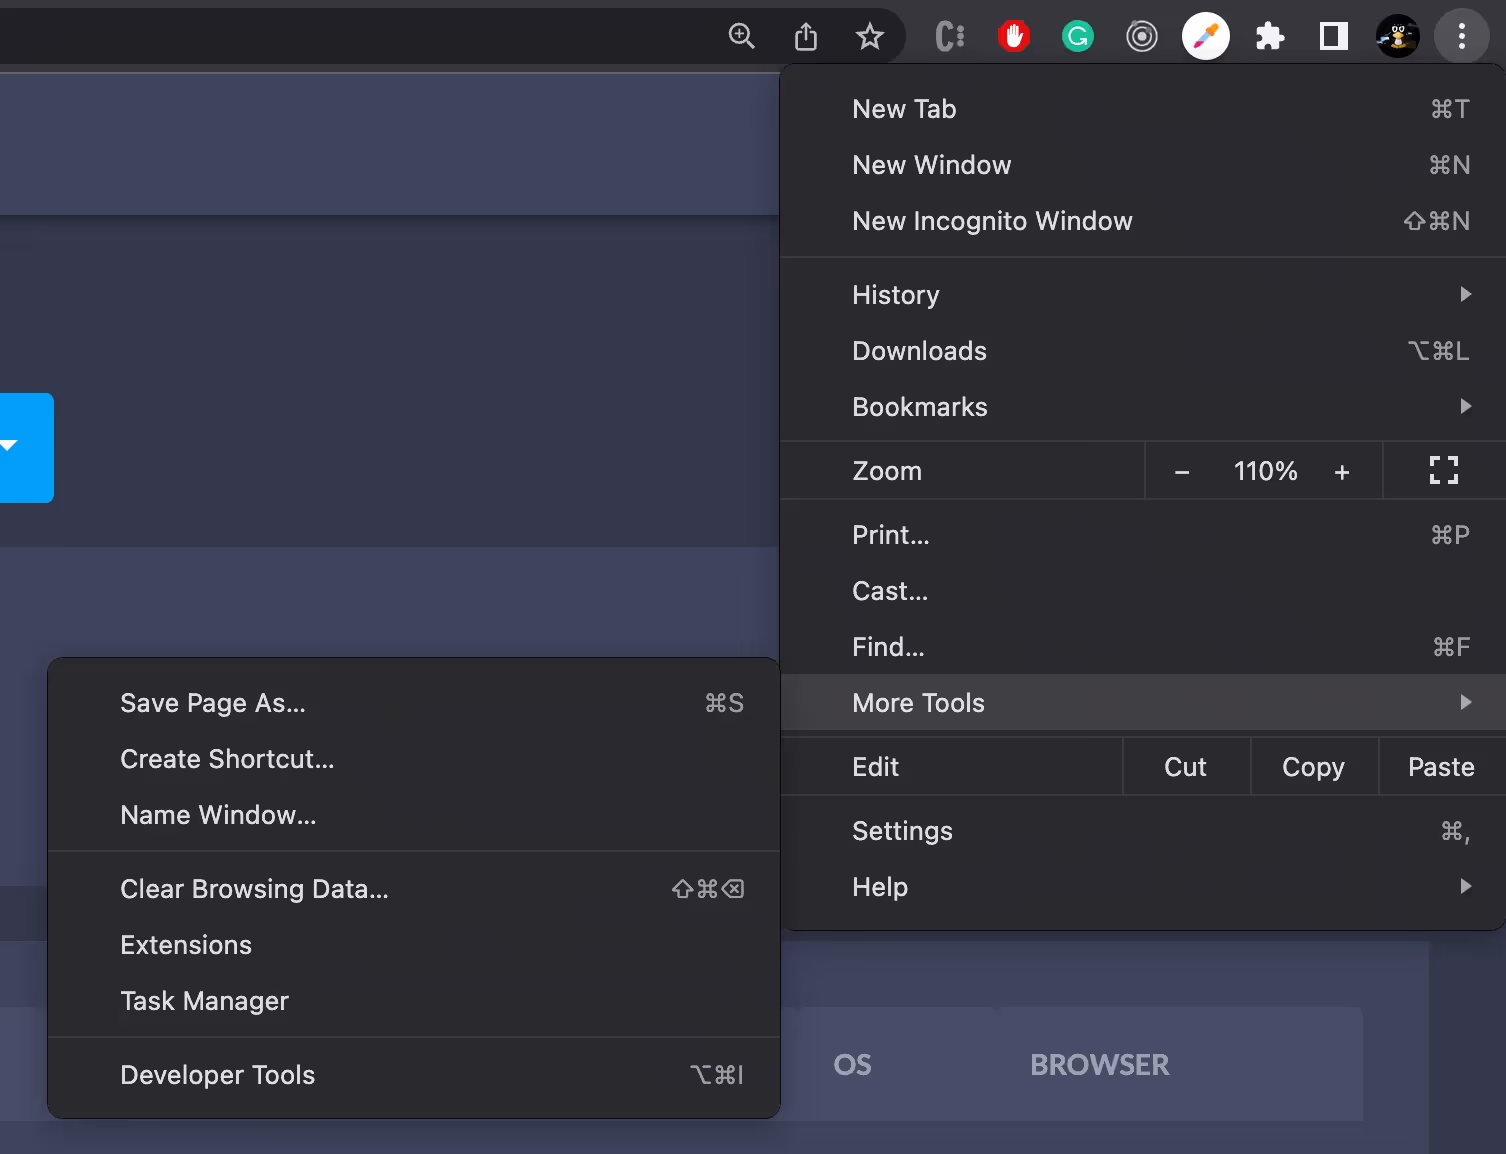
a] Open Google Chrome Browser
b] At the Top Right Corner Click on Three Dots > More Tools > Developer Tools > Network Tab
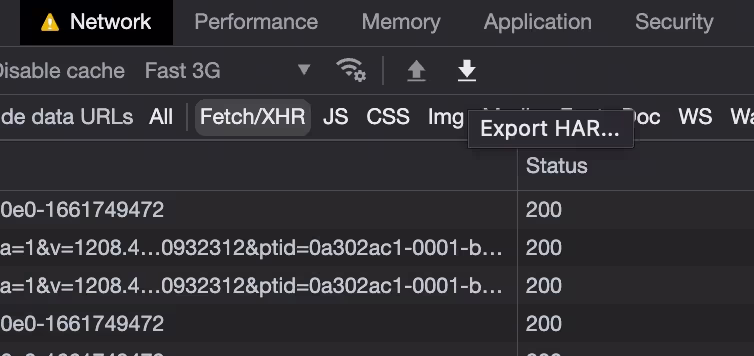
2.After opening the network tab, we can see the small icon (⬇️) which we can use to Export HAR... file.
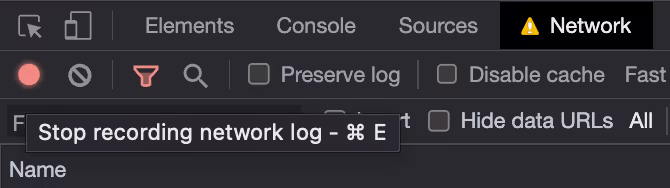
3.Note: To get the site loading content, we have to make sure our site network log recording is enabled and after that, we have to refresh/reload the site we need to perform analyses of network requests, Please see the image and small red circle icon (🔴) indicates that network logs recording is on.
4.That’s all, now we can export our HAR file to analyze it.
Note: To understands chrome’s network tab in detail you can refer to this link.
Structure of the HAR file
We are going to take the network request example from Zipy.ai | Debugging made lightning fast
In the below-attached image from Zipy, we can see network request timings on the popup, I’m using Google Chrome’s network tab screenshot.
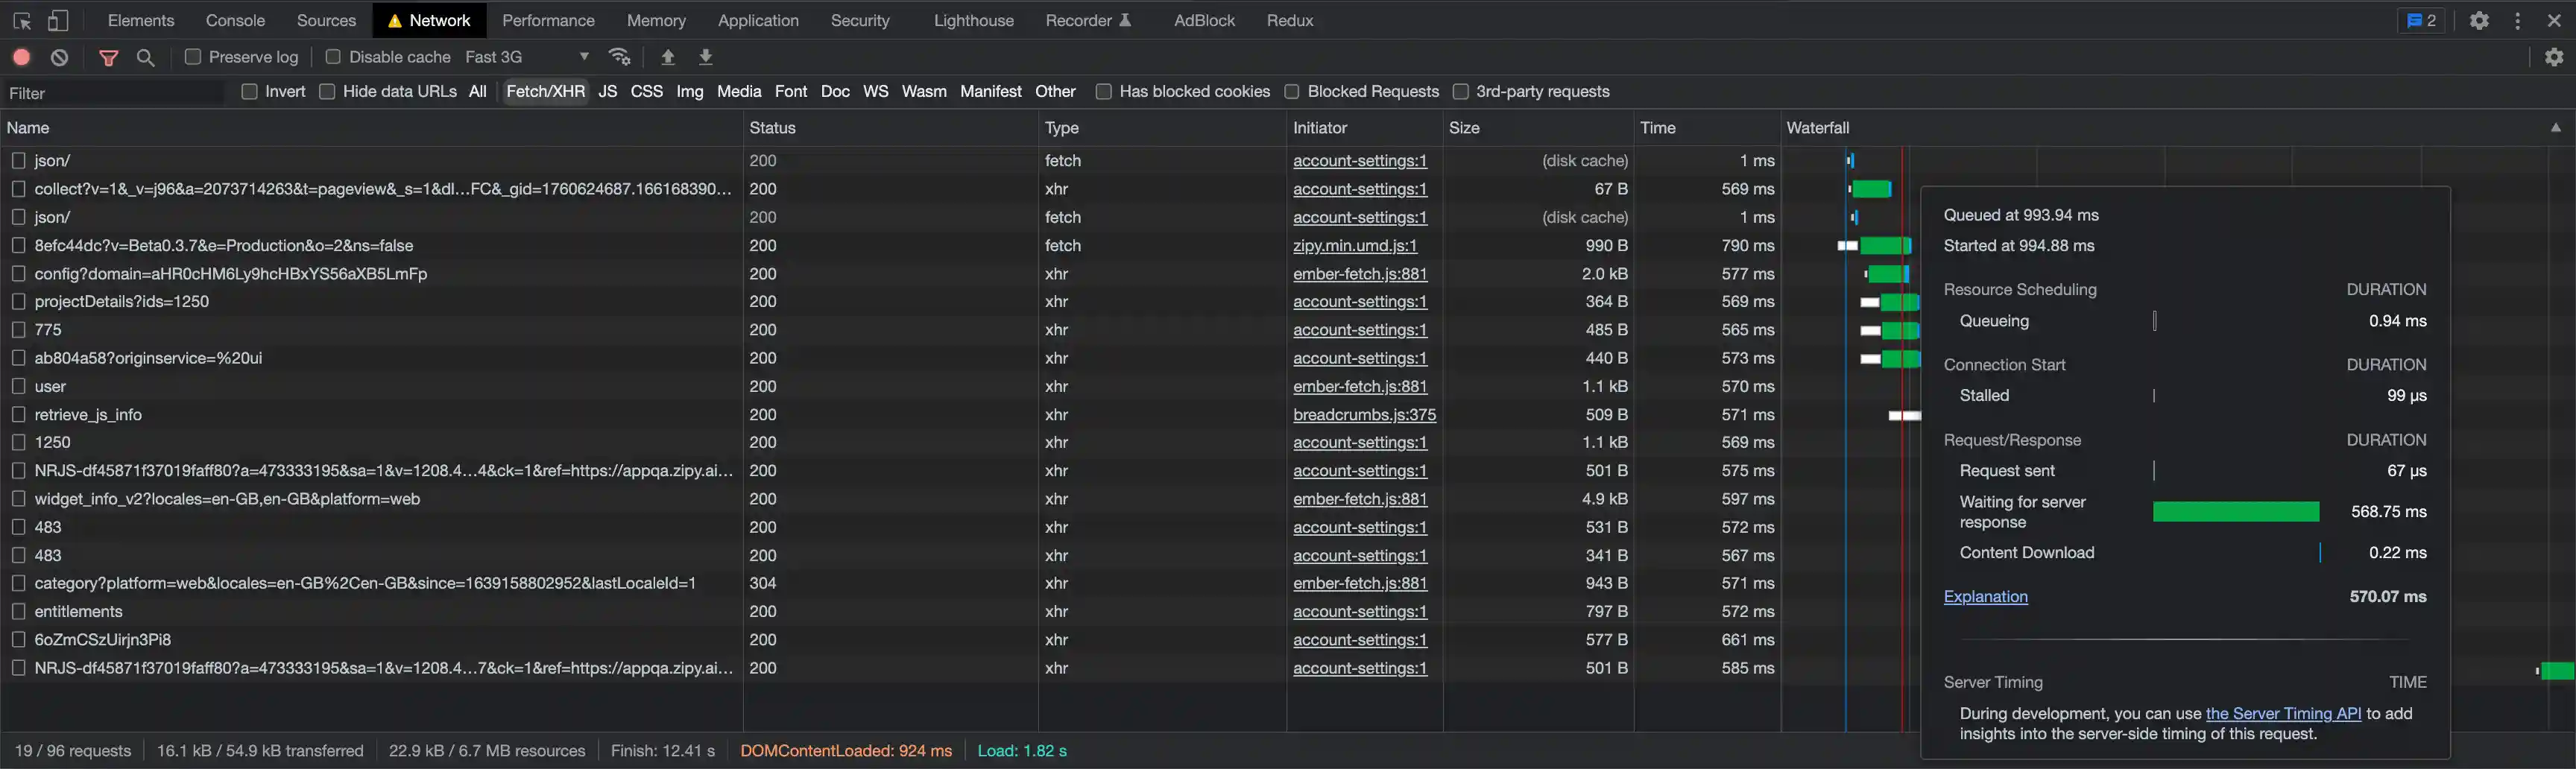
The network request resource data (name, status, type, size, and time) are displayed in the sample image above, along with the waterfall.The information regarding request timings is shown in graphical chart form in the network waterfall.
The network tab has the ability to log the specifics of each network request; however, in order to do a thorough analysis and maintain or create a backup of the current network request log, we must export the network request as a HAR file.
Note: Before sending the HAR file to anyone, you have to verify its content as it can contain privacy & security sensitive information which you don’t want to share with everyone.
Below are the sample JSON from the HAR file:

The above image is only a small part of the HAR file, the root structure is as below:
Let’s see the details
- version [string] - A version is a number in string format. If empty, string "1.1" is assumed by default.
- creator [object] - A name and version info of the log creator application (it depends on the browser).
- browser [object, optional] - Name and version info of used browser, the structure of browser object is same as a creator object.
- pages [array, optional] - All the logged pages by DevTools.
- entries [array] - This will hold all logged requests by DevTools.
- comment [string, optional] (new in 1.2) - A comment provided by the user or the application.
Let’s see the entries structure:
- pageref [string, unique, optional] - Parent Page Reference. Leave if the web application does not support grouping by page. (example: Single Page Application).
- startedDateTime [string] - ISO Date Time String when request is started (ISO 8601 - YYYY-MM-DDThh:mm:ss.sTZD).
- time [number] - Total request time in milliseconds, This is an aggregation of all timings available in the timings objects excluding -1 values.
- request [object] - Detailed info about the request.
- response [object] - Detailed info about the response.
- cache [object] - Info about cache usage.
- timings [object] - Contains details about timings of request/response round trip.
- serverIPAddress [string, optional] (new in 1.2) - Connected IP address of the server after resolving the DNS.
- connection [string, optional] (new in 1.2) - Unique ID of the TCP/IP connection, we can use the port of the client or server however if the port number is not unique we can use any unique ID
- comment [string, optional] (new in 1.2) - A comment given by the user or the application.
NOTE: To understand the format in detail you can refer to this link.
Summary
We have seen the general information regarding the HAR file. In essence, the HAR file contains the site load and the timings of the various resource executions, such as JS, CSS, XHR, etc., and may be used to share the site network logs for additional analysis. Since the network log's details are presented in JSON, understanding it is really simple.
TBD: In Zipy, we are using HAR file specification to show the network requests captured using zipy sdk
Explore More Blogs
If you enjoyed this blog, here are some other topics you might find interesting:
- Understanding Continuous Integration and Continuous Delivery (CI/CD)
- The challenges of being the only finance person in a team of Techies
- Best way to grow your SaaS business using cold emails
- The big data big debate: Batch Processing vs Stream Processing
- Deno vs Node - a side by side comparison
- Self Managed Vs Managed Kafka Service
- Why Load Test Often & Early: Our Experiments with Gatling
- Deep Dive Into ClickHouse
- Benefits of Dogfooding with Zipy


.webp)