.svg)


We live in a world that’s not just mobile-first anymore, it’s AI-first too.
And in this new landscape, mobile apps aren’t side projects or support channels. They are the business. They drive growth, keep users engaged, and increasingly, open the door to revenue.
But building features isn't enough. Growth today comes from delivering smooth, reliable experiences. That means bugs can’t be an afterthought. And this is where AI starts to matter in a different way. AI for mobile debugging is starting to change how we build and debug them.
But here’s the thing: the tools we use to build and debug these apps haven’t kept up. Still, in the era of 'AI for everything', Most teams are relying on Crashlytics. It’s solid for crash reports. But mobile development today is about way more than just crashes.
Modern apps are complex, asynchronous, and deeply integrated with cloud services. Users expect them to be fast, smooth, and bug-free. And when something goes wrong, it’s rarely a clean crash, it’s lag, bad state, or some weird edge case that doesn’t even throw an error.
Developers need better visibility. Not just into when things break, but why. They need tools that show real-world app behavior, not just stack traces.
If we want to keep up with the pace of mobile innovation, we can’t afford to debug like it’s 2015. It’s time to move beyond crash logs and embrace tools built for how apps are built today.
Crashes Are Only the Visible Failure
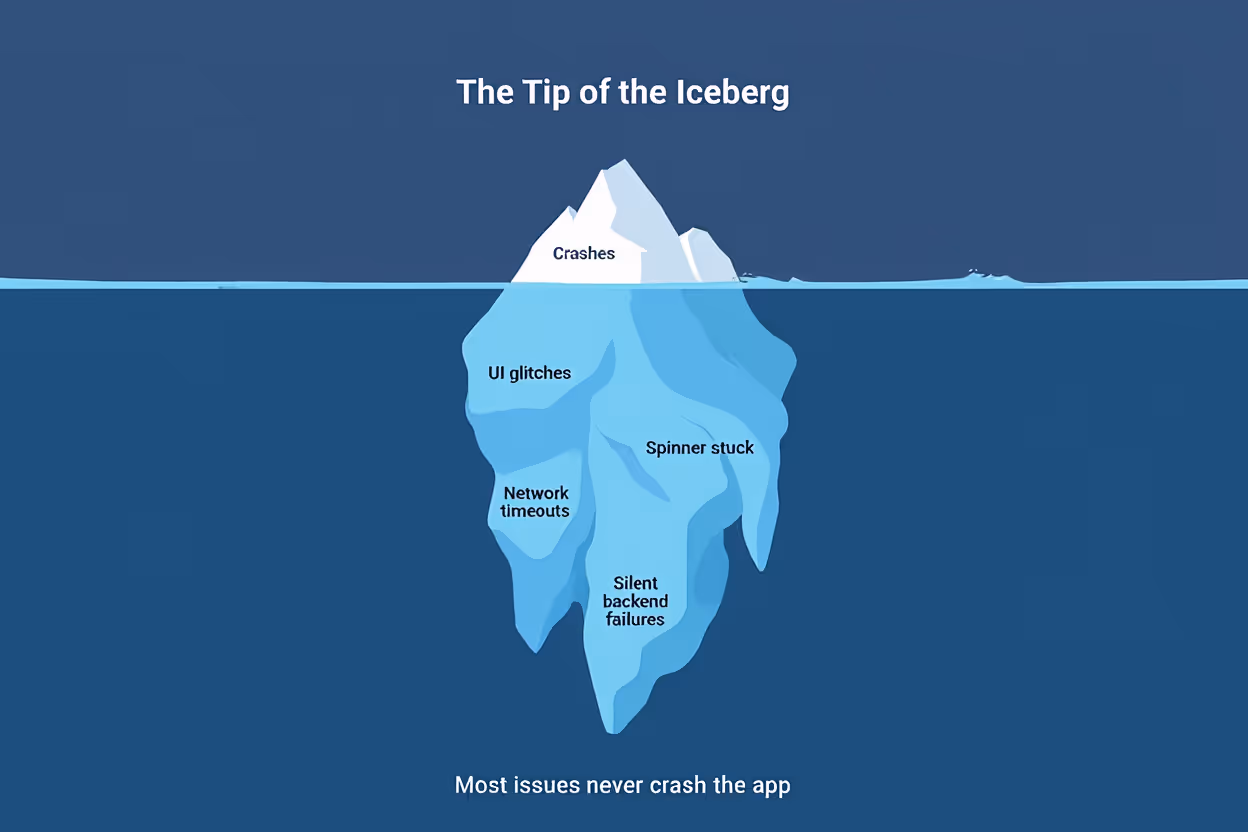
Crashlytics tells you when the app falls over and gives you a stack trace. But most things that hurt users aren’t crashes. They’re slow leaks:
- UI that flickers or shifts
- Spinners that never stop after a stalled call
- Navigation or state that jumps to the wrong place
- APIs that return nothing and never raise an error
Most users won’t report this. They just leave.
Example: In a D2C ecommerce app, a coupon looks applied, but the backend times out. No exception, no alert. The price never updates, so the shopper abandons checkout.
To catch this kind of failure you need:
- Session replay to see it
- Network logs to explain it
- Real-time monitoring that tracks soft errors, not just fatal ones
Session Replays: See What Actually Happened, No Screen Recording Needed

When someone says, “The checkout button didn’t work,” Crashlytics has nothing to show you. No crash, no stack trace, just a dead end.
Session replay for mobile changes that. It lets you watch exactly what the user saw and did:
- Which screens they visited
- What buttons they tapped
- What calls fired, and which ones quietly failed
Example: A fashion app notices drop-offs during size selection. Replays show that on the iPhone 13 Mini, the size chart button is misaligned and unclickable due to a layout bug.
This isn’t surveillance. It’s debugging with context. You stop guessing and start seeing, cutting hours of digging down to minutes of answers.
Network Monitoring: The Silent Killer
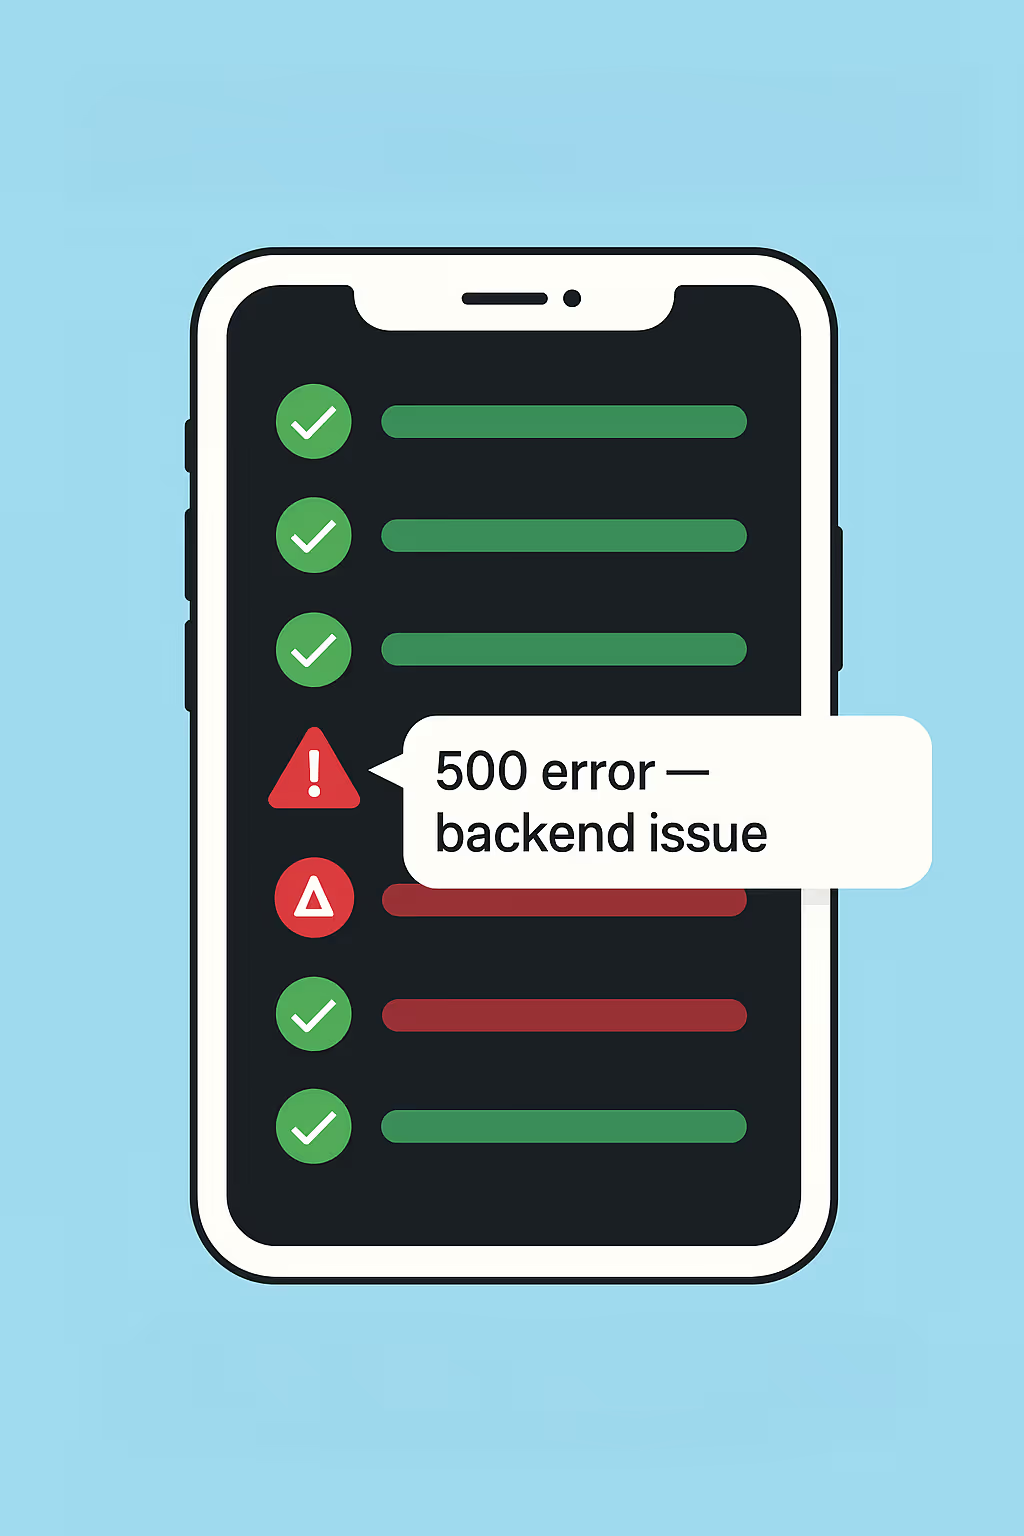
Most bugs in mobile apps don’t start in your code, they come from the network layer or backend services:
- A 500 error from a erroneous state backend service
- A timeout when the user’s on a weak Wi-Fi
- A malformed JSON response that breaks parsing silently
Crashlytics won’t catch any of this. No crash, no clue.
What you need is full network visibility: every request auto-captured, with status codes, payloads, and timing.
Example: In a beauty D2C app, users hit “Track Order” and get stuck. No error shown. Network logs reveal the shipping API is sending bad data for specific Pincodes.
Without network monitoring, you’re flying blind. With it, you see the real cause, instantly.
Framework Complexity: React Native, Flutter, Native iOS & Android
App development used to be simpler. You picked a platform, chose a native language, and built everything there.
Now it’s rarely that clean.
Most teams end up using a mix, Flutter to hit both Android and iOS, React Native when they need to ship something fast, and native code for the bits where speed or hardware access really matters.
But here’s the problem: debugging across these layers is a mess.
You can trace a bug in one stack, but if it hops across to another, good luck with that. Most tools weren’t built to handle this kind of cross-stack chaos. They give you tunnel vision when what you need is a wide-angle lens.
Real case: A direct-to-consumer fashion brand built their app using Flutter. But for payments, they pulled in a Native plugin. Everything worked fine, until Android 12. On that version, payment redirection broke. The bug was buried somewhere between Flutter and native Android behavior. And because their tools couldn’t see the whole picture, it took days to track down.
A cross-platform debugger that actually understands how these layers interact wouldn’t just be useful, it’s becoming essential.
AI-Powered Insights: Prioritize What Actually Matters
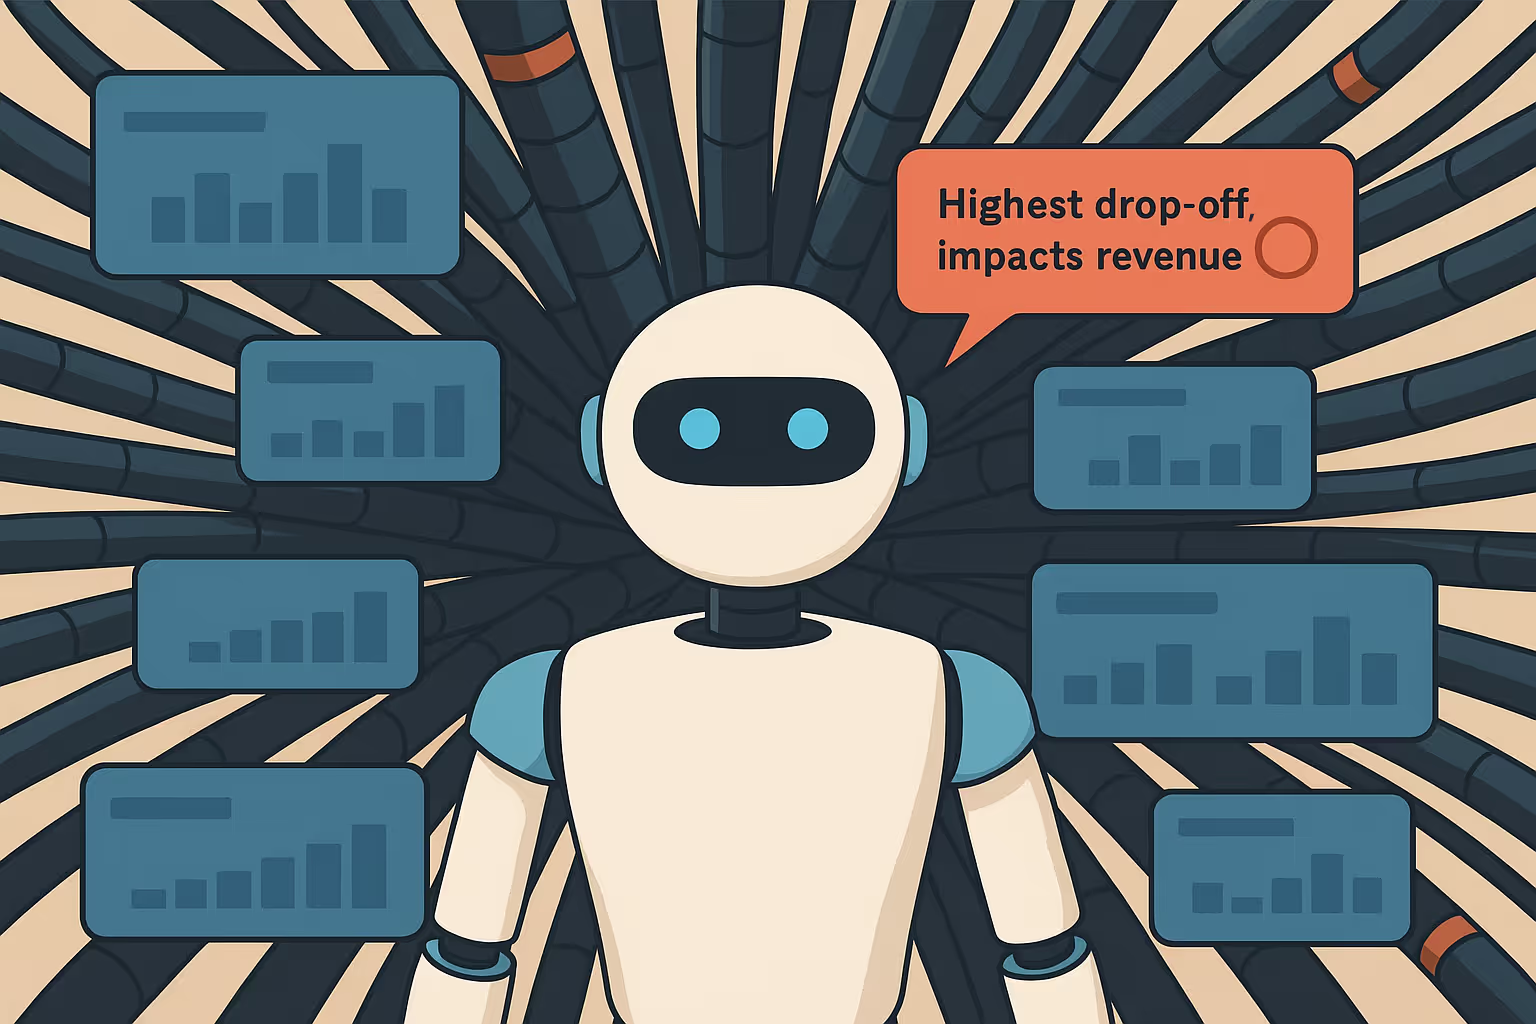
Most of what comes through in logs and crash reports isn’t worth your time. You’ll see dozens of issues every day, and chasing all of them just burns hours.
The real challenge isn’t fixing bugs, it’s figuring out which ones actually cost you users or money. Finding and fixing what matters.
AI doesn’t magically solve that, but it’s pretty good at spotting patterns you’d probably miss. Not dramatic stuff, just enough to tell you:
- “Hey, this one keeps happening to users who actually stick around.”
- “People are rage-tapping here more than anywhere else.”
It’s not perfect, but it gives you a better filter. And that’s usually what you need most.
- A crash that hits paying users
- A weird pattern that shows up in frustrated sessions
- Or something subtle, like a bug only happening on dual-SIM Android phones in Tier 2 cities
Real example: SMS autofill failing during OTP. It looked fine on most phones, but in some regions, users just dropped off. Quietly, but consistently. AI spotted it way before anyone on the team noticed.
This isn’t about fixing faster. It’s about not wasting time on things that don’t matter.
The Cost of Ignoring Silent Failures
Some bugs don’t crash anything. They just quietly ruin the experience, and if you’re not watching closely, you won’t even know it’s happening.
Stuff like:
- Users getting stuck on onboarding because a spinner never finishes
- A checkout screen freezing if permissions are denied
Nothing explodes, but people leave. And unless you’re capturing that moment, you’ll just see the uninstall numbers go up and not know why.
Example: A skincare app, tons of users dropping off in the first session. No crashes, no errors. Just silence. A replay finally showed the real problem: if the app couldn’t get location access, it just hung there. No fallback, no exit. Dead end.
By the time the metrics show you something’s wrong, the damage is already done.
You need to see this stuff as it happens, not after.
The Future of Mobile Debugging: Less Reactive, More Aware
Crash reporting isn’t enough anymore. It helped when apps were simpler, but now the real problems are deeper:
- Bugs that span frameworks
- Issues that only show up for specific devices
- Failures that don’t throw errors at all
What mobile teams need now is visibility, not just into crashes, but into what users are actually experiencing: where they get stuck, where they give up, and why.
If you’ve worked on real mobile apps, you already use Crashlytics. It’s the default for catching crashes. For a while, that was enough.
But over the last few years, you’ve probably noticed the problems change shape. Apps don’t just crash, they stall, misbehave, and get stuck in strange places where no exception is thrown. You see “no issues” in Crashlytics, but users still leave bad reviews, support tickets pile up, or conversion drops and you don’t know why.
That’s exactly why we built Oopsie.
Meet Oopsie

Oopsie doesn’t replace Crashlytics, it extends it. It plugs into the gaps you’ve already felt:
When a session goes sideways with no error, Oopsie shows you the actual user path. See what they did, what the app did, and where the flow silently failed. No more trying to reconstruct the problem from vague user complaints or logs that don’t tell the full story.
For every strange bug that never shows up in your crash reports, network issues, backend delays, UI glitches that annoy users but don’t crash the app, Oopsie surfaces the signal. You see every network call, response, and timing, mapped to what the user was doing at that moment.
When debugging messes with hybrid stacks, Flutter or React Native mixed with native code, Oopsie tracks bugs as they move across those boundaries. You finally get a unified view, not just bits and pieces from each platform.
Oopsie collects a high volume of diagnostic data without overwhelming your team. Its AI engine identifies root causes, prioritizes impact, and surfaces the most relevant issues.
- AI filters noise and surfaces the most critical, actionable issues.
- Detects UI and usability errors that don't show up in crash reports.
If you're familiar with Crashlytics, you already know that it doesn’t catch everything. That's where Oopsie steps in, giving you visibility into the issues Crashlytics misses. But if you're committed to using Crashlytics and just need better insight when things fail silently, you can integrate Zipy with Crashlytics to get the best of both worlds.
We built Oopsie because we were tired of invisible failures costing real money and user trust, problems that slipped past all the “no new crashes” metrics. We still use Crashlytics for the big wrecks.
But now, with Oopsie, we see the subtle breaks too.


.webp)