.svg)


Quick Answer
Performance monitoring tools are important pieces of software that keep an eye on, analyze, and improve the performance of applications, APIs, and IT infrastructure all the time. These digital protectors stop expensive downtime, find problems before they affect users, and make sure that digital experiences go smoothly. The right monitoring tool can make systems much more reliable and users much happier. For example, open-source tools like Prometheus and enterprise platforms like Dynatrace.
What do systems do in digital apps?
Systems are the most important part of all digital applications in today's fast-paced world of technology. These systems have a direct effect on every part of the user experience. Just as a well-tuned engine makes a car run smoothly, the best performance makes digital platforms work well.
Tools for monitoring performance keep an eye on the health of a system without making a sound. They keep an eye on applications all the time and stop small problems from turning into big ones. These digital guards cut down on expensive downtime, make better use of resources, and make sure that users have smooth experiences.
What are tools for monitoring the performance of APIs?
API performance monitoring tools keep an eye on application programming interfaces (APIs) to make sure they work as well as possible. These specialized tools give you real-time information and the ability to improve things. They keep the API working well and reliably, even when a lot of people are using it.
APIs are what modern businesses use to link services, apps, and data sources. If you don't keep an eye on them, API failures can cause system-wide outages.
What are the most important features of performance monitoring tools?
Real-Time Monitoring Capabilities
- Continuous tracking: Keep an eye on how well the API is working so you can find problems right away
- Latency analysis: Check how long it takes for API requests to get a response
- Monitoring uptime: Make sure that API endpoints are always available
Testing and Advanced Analytics
- Error tracking: Find fault codes and exceptions in API responses
- Traffic analysis: Keep an eye on how API traffic comes and goes
- Load testing: Stress-test APIs by simulating different levels of traffic
- Security scanning: Find security holes and threats
Features for Improving Performance
- Response time analysis: Find slowdowns and problems with performance
- Rate limiting: Stop the API from getting too busy by limiting requests
- Transaction tracing: Find problems by following each transaction
- Endpoint testing: Check the performance and functionality of certain APIs
Why Should You Use Tools to Monitor API Performance?
Benefits for Performance and Reliability
Monitoring tools can find bottlenecks, which makes performance optimization possible. These tools make the system more efficient and speed up response times. Applications run faster and more reliably for users.
Reliability assurance makes sure that APIs are always available and responsive. Monitoring tools find errors or downtime right away. This lets you act quickly before users see any problems.
Benefits of Scalability and Troubleshooting
Scalability assessment helps apps meet the needs of more and more users. Performance tools check to see how APIs handle more traffic. They find possible scaling problems before they affect users.
Troubleshooting efficiency makes it faster to fix problems when they come up. These tools are like digital detectives that can quickly find the root causes. Solving problems faster cuts down on downtime and makes users less angry.
Benefits for Security and Cost
Security monitoring finds strange access patterns and attempts that aren't allowed. Performance tools deal with security threats before they get worse. This proactive approach keeps sensitive data safe and the system running smoothly.
Cost efficiency means using resources to their fullest and lowering infrastructure costs. Monitoring tools help businesses make the best use of their servers and avoid giving too much to them.
Compliance and User Experience
Applications that run smoothly and respond quickly lead to a better user experience. Performance monitoring makes sure that users can interact with each other without any problems. Customers who are happy are more likely to stay loyal.
Compliance support helps businesses follow the rules set by the government. Monitoring tools keep an eye on API performance metrics and report them. This paperwork is very important for audits and compliance checks.
What are the best tools for keeping an eye on performance?
Zipy.ai: Monitoring sessions and fixing problems before they happen
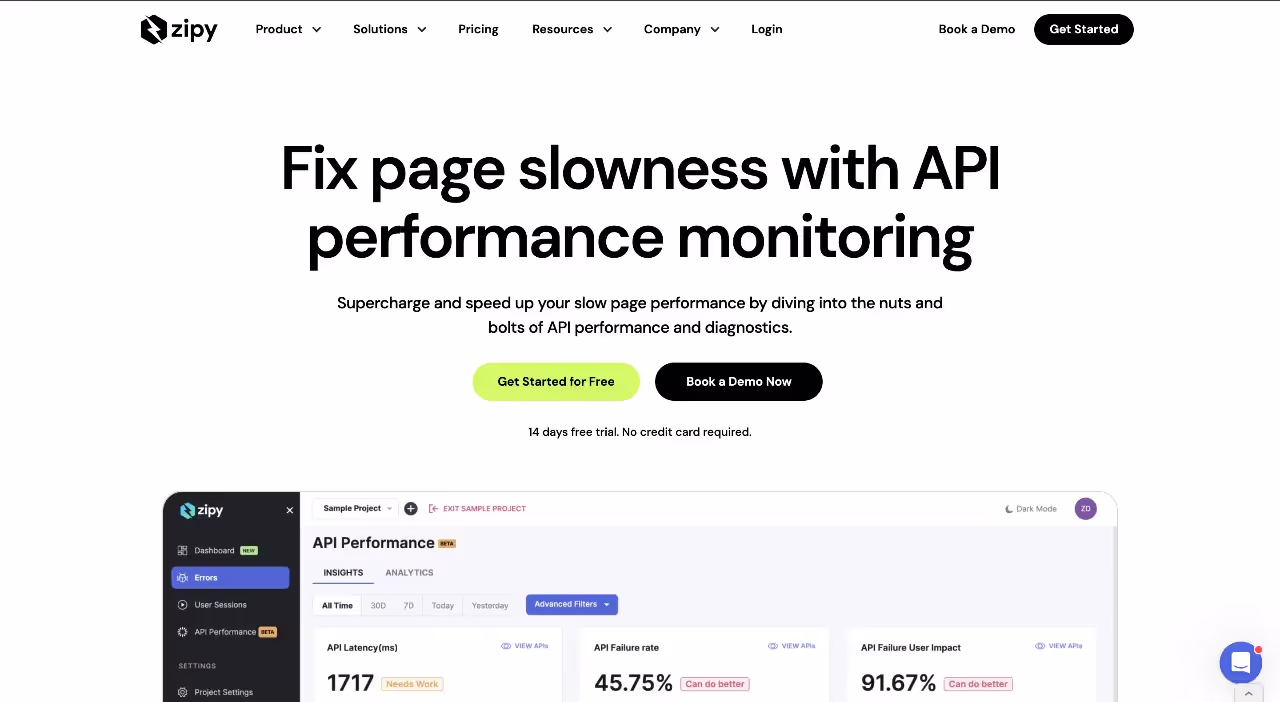
Best for: checking on user sessions in real time and fixing problems before they happen
Zipy.ai's main business is keeping an eye on user sessions in web apps. As errors and exceptions happen in real user environments, this tool keeps track of them. You only need to add two lines of JavaScript SDK code to install it.
Pros: You can replay sessions in real time, monitor the frontend in detail, analyze the network in detail, and access the console log.
Cons: It can be hard for new users to learn, and they need to know how to use debugging tools.
Postman : a platform for developing and testing APIs.
Best for: teams that work on APIs and automated testing processes
Postman has everything you need to develop and test APIs. The Postman Monitors feature lets you check performance on a set schedule. This tool can handle a lot of different HTTP request methods and lets you write your own scripts.
Pros: It can run tests automatically, manage environments, let teams work together, and connect to a lot of other apps.
Cons: Not enough real-time monitoring, basic reporting features, a learning curve for new users, and more money for advanced features.
Apigee : a platform for managing enterprise APIs.
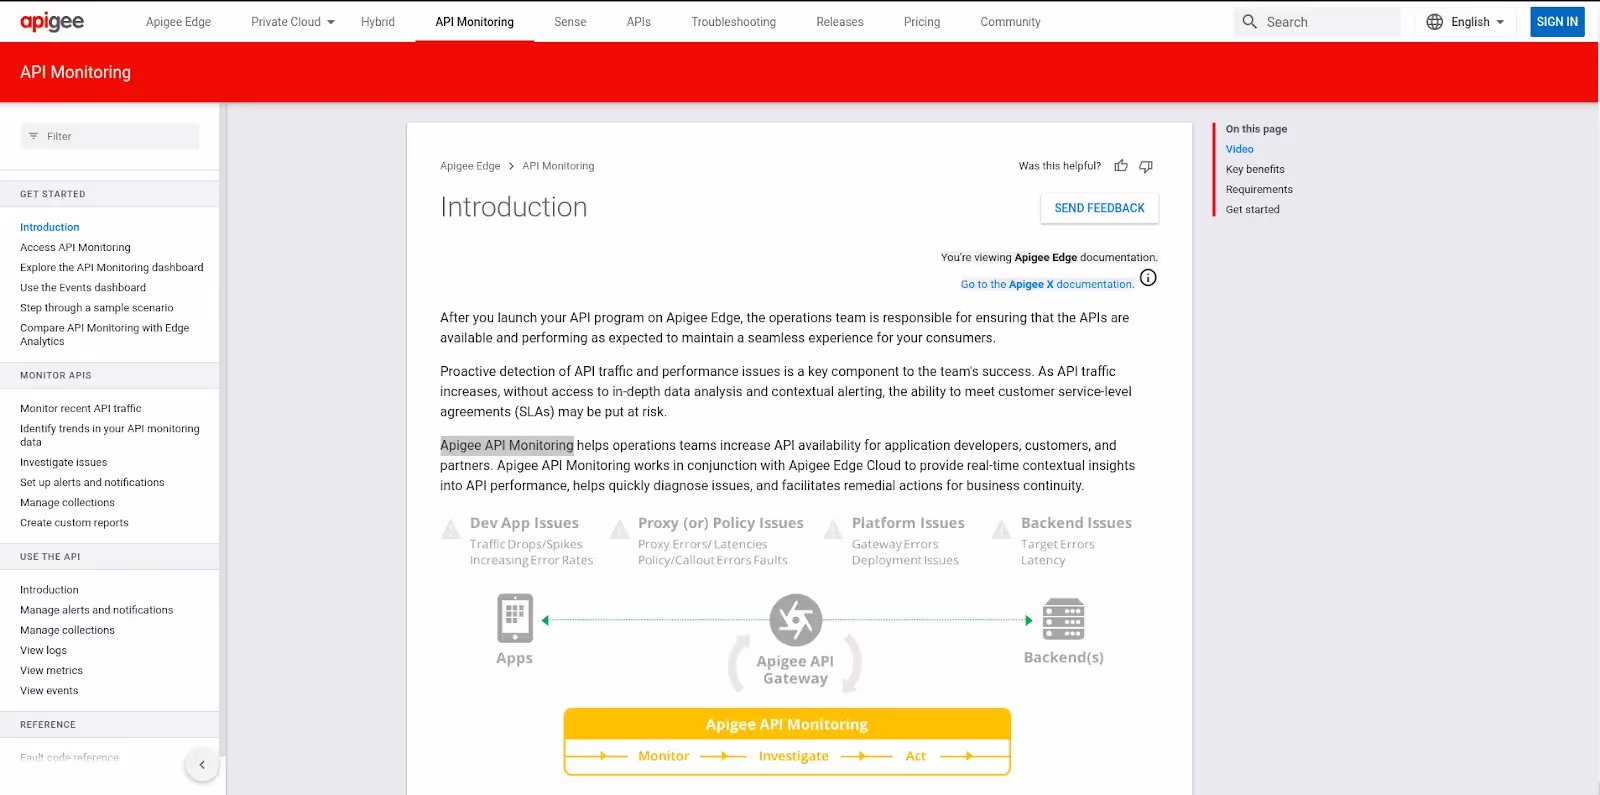
Best for: Big companies that need to manage the entire API lifecycle
Apigee, which is owned by Google, takes care of the whole API lifecycle. This platform takes care of design, building, deployment, and monitoring. It has enterprise-level security and analytics, which makes it good for big businesses.
Pros: Full API management, strong security features, in-depth analytics, and the ability to deploy in multiple clouds
Cons: hard to learn, not many ways to customize, possible vendor lock-in, needs a lot of resources to run, and costs more.
Advanced Performance Monitoring Solutions for Business Apps
DataDog : a cloud-based platform for monitoring and analyzing data.
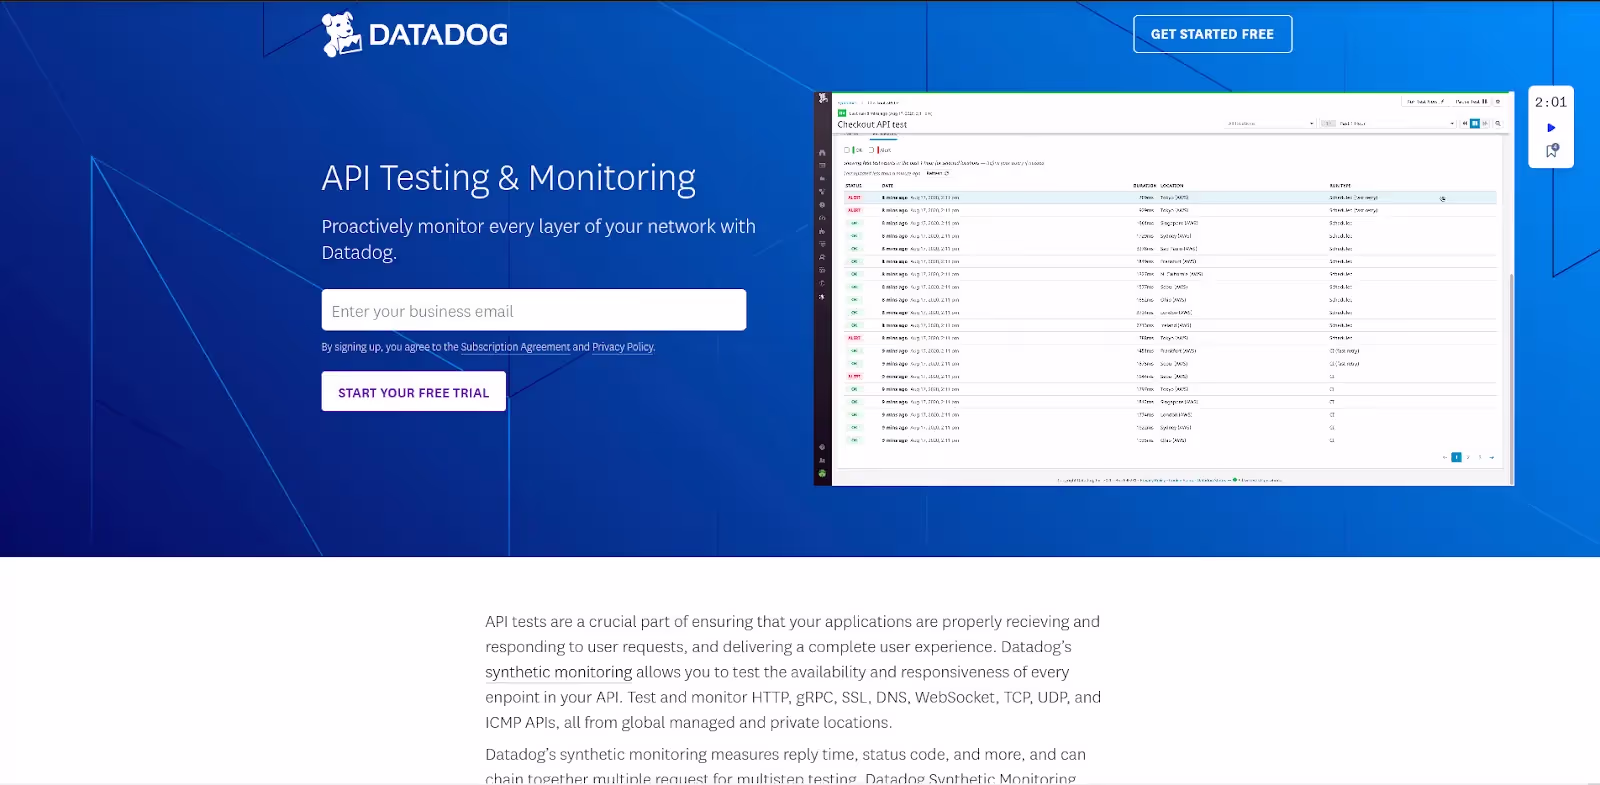
Best for: Companies that need to keep an eye on all of their cloud-based infrastructure and applications
DataDog lets you keep an eye on and analyze your IT infrastructure, apps, and services in the cloud. This platform gives you full visibility across the system and full API performance monitoring. Companies use DataDog to keep their distributed systems running at their best.
The platform is great at giving you real-time information across many layers of the system. DataDog's best feature is that it can connect data from different sources.
Pros: You can see the whole system, get performance metrics in real time, use a scalable architecture, and use AI to find problems.
Cons: The setup process is complicated, there is a chance of data overload, the free plan has limited features, monitored systems use more resources, and advanced features cost more.
New Relic : the best at monitoring application performance.
Best for: Development teams that want to improve the performance of their apps and keep an eye on the user experience
New Relic is a company that focuses on keeping an eye on how well web and mobile apps work. This platform gives you real-time information about how apps work and how users feel about them. Development teams use New Relic to find performance problems before they happen.
The tool lets you keep an eye on all of your applications, servers, databases, and infrastructure. New Relic's focus on users helps teams see how performance affects end users.
Pros: It covers all aspects of performance, can be monitored in real time, gives insights that are useful to users, has customizable dashboards, works with a lot of different technologies, and can be used by organizations of any size.
Cons: Hard to set up, limited features on the free tier, monitoring agents add to the app's overhead, data retention is limited, it takes a long time to learn, and small businesses have to pay more.
Dynatrace: AI-Powered Management of Application Performance
Best for: big companies that need automated problem solving and full application visibility
Dynatrace offers AI-powered application performance monitoring and the ability to fix problems automatically. This platform gives users full visibility from the end to the infrastructure parts. Enterprise companies choose Dynatrace because it uses smart monitoring.
The AI engine in the platform cuts down on the time it takes to find and fix performance problems. Dynatrace gives you a complete picture of all the application stacks.
Pros: AI-powered problem solving, full visibility of applications, scalability for businesses, an easy-to-use interface, and a large ecosystem for integration.
Cons: Hard to set up for beginners, uses a lot of resources, limited on-premises support, expensive pricing model, and costs go up based on usage.
Monitoring the performance of business transactions with AppDynamics
Best for: Companies that need to keep an eye on transactions that are important to the business and improve performance in real time
AppDynamics is a company that focuses on monitoring the performance of applications, with a focus on analyzing business transactions. This platform lets you see how well your apps are working in hybrid environments in real time. Companies use AppDynamics to figure out which performance improvements will have the biggest effect on their business.
The solution lets you keep an eye on everything, from how users interact with the system to how well the infrastructure works. AppDynamics helps teams stay focused on performance problems that are hurting important business operations.
Pros: A monitoring approach that focuses on business, real-time performance insights, full application coverage, the ability to scale in a hybrid environment, an interface that is easy to use, and the ability to solve problems before they happen
Cons: The initial setup is complicated, the monitoring agents use a lot of resources, it's hard to customize, the learning curve is steep, and the prices are high for smaller businesses.
LogRocket: Monitoring Frontend Performance and User Experience
Best for: Frontend development teams that need to be able to analyze user interactions in detail and replay sessions
LogRocket's main business is keeping an eye on web and mobile apps through session replays and analysis of user interactions. This platform helps developers figure out what users are doing and fix problems with their apps. LogRocket gives frontend teams visual information about how users interact with their products.
The tool is great at reproducing bugs that are hard to find by recording sessions. LogRocket gives you detailed error reports that show what the user was doing at the time of the error.
Pros: It has a full session replay feature, visual insights into how users interact with the site, detailed error reporting with context, useful user analytics, easy integration with other frameworks, and options for privacy compliance.
Cons: Session recording slows down performance, user data privacy issues, only works with web and mobile apps, new users have to learn how to use it, and the price is based on how many users it has.
How do these tools stack up against each other for different uses?
Things to Think About When Choosing Between an Enterprise and a Startup
Enterprise organizations can get a lot out of full platforms like Dynatrace and AppDynamics. These tools have advanced features, AI-powered insights, and a lot of room to grow. Enterprise pricing models make the investment worth it by lowering the costs of downtime.
Startup companies often choose tools like LogRocket or Zipy.ai to keep an eye on certain things. These solutions offer specific features without the complexity of an enterprise-level system. Their prices are low enough that they are available to growing businesses.
Requirements for Cloud-Native and Hybrid Environments
Cloud-native apps work best with the DataDog and New Relic platforms. These tools work best in environments with containers and microservices. Cloud-first design makes sure that performance monitoring is as good as it can be.
Tools like AppDynamics that work with both cloud and on-premises infrastructure are needed in hybrid environments. These platforms keep an eye on things consistently across different technology stacks.
Each tool for monitoring performance meets certain technical and organizational needs. When choosing the best solution, think about your budget, infrastructure, and monitoring goals.
Performance Monitoring Tools That Are Open-Source and Cloud-Native
Prometheus : a free and open-source toolkit for monitoring and alerting.
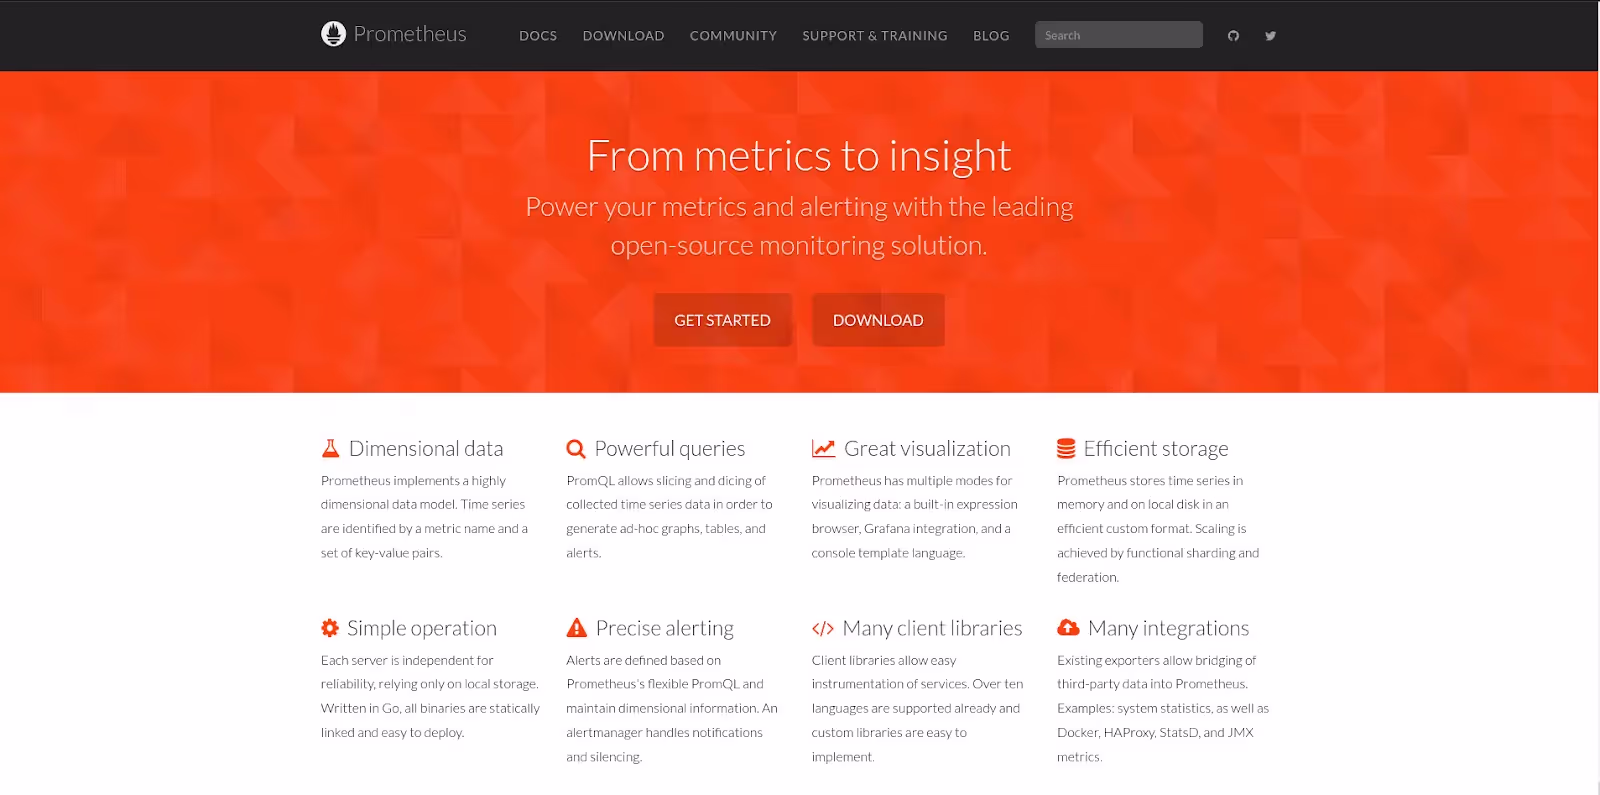
Best for: DevOps teams and companies that want open-source monitoring tools that can do a lot of different types of queries.
Prometheus is an open-source tool that lets you monitor and get alerts for infrastructure, applications, and services. This Cloud Native Computing Foundation project was first made at SoundCloud and works great in DevOps settings. Prometheus is popular with businesses because it is flexible and has a community-driven development process.
The platform stores time-series data efficiently by using a multi-dimensional data model. Prometheus has a powerful query language called PromQL that lets you do a lot of different types of queries.
Pros: A powerful multi-dimensional data model, the ability to scale up easily in complex environments, real-time alerting, a rich PromQL query language, a large exporter ecosystem, easy integration with Grafana, and active community support.
Cons: It uses a lot of resources, doesn't have a lot of long-term storage options, is hard to set up, doesn't have built-in distributed tracing, is hard to configure for high availability, and has a steep learning curve for PromQL.
Logz.io : a cloud-based platform for observability.
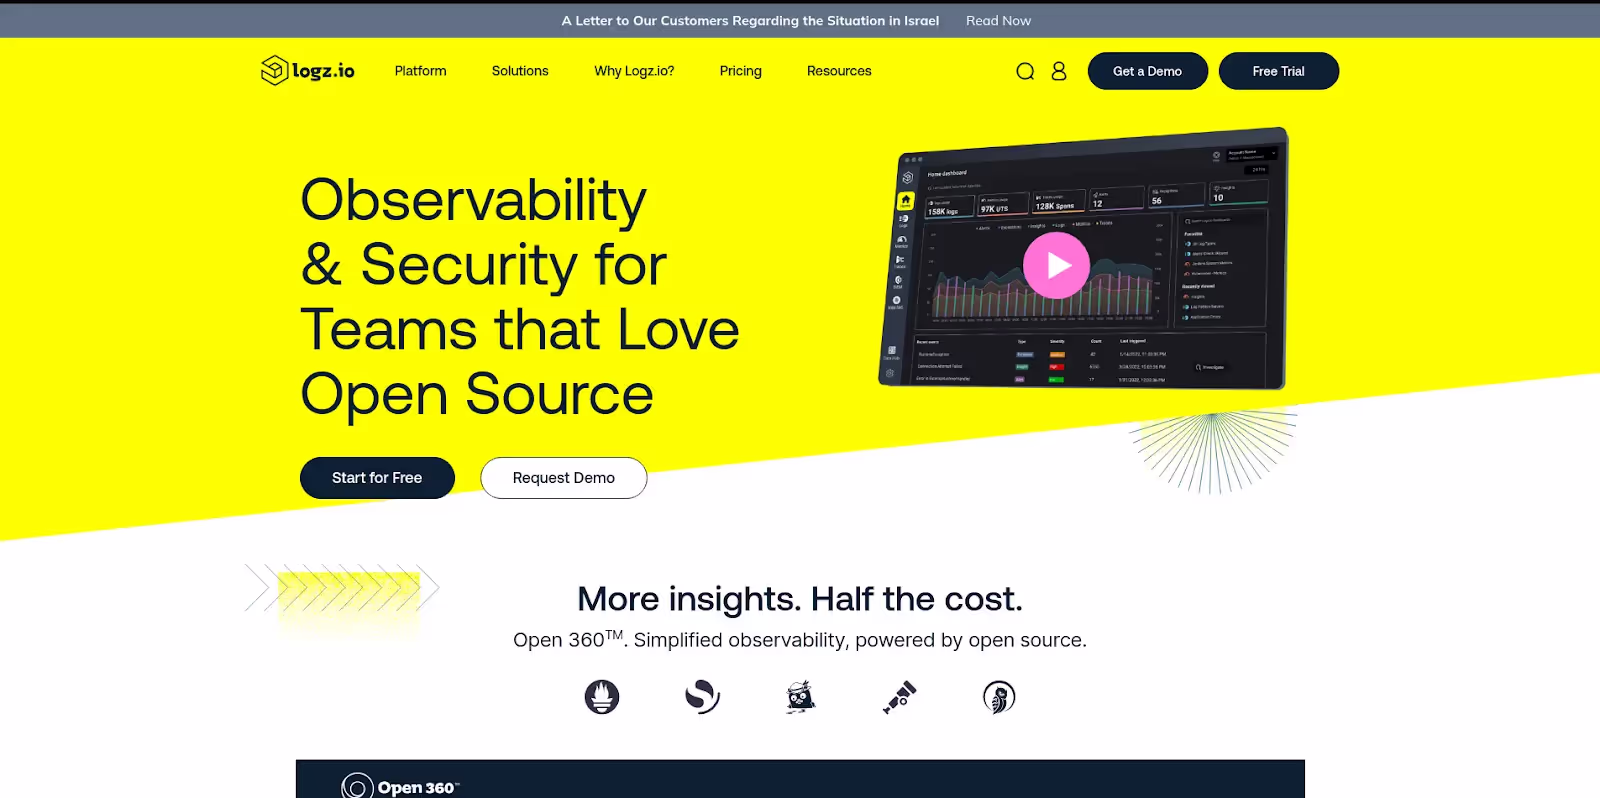
Best for: Companies that want to see everything that happens on their systems in one place, including log management, metrics analysis, and distributed tracing.
Logz.io lets you see what's going on in the cloud with applications, systems, and infrastructure monitoring. This platform has features for managing logs, analyzing metrics, and tracing across multiple systems. Companies use Logz.io to keep an eye on their entire tech stack and get health insights.
The platform can find patterns and anomalies using machine learning. Logz.io has built-in security features, such as SIEM components for more advanced monitoring.
Pros: It can scale easily in the cloud, has a user-friendly interface and setup, can connect to many different data sources, can find anomalies with AI, has built-in security features, and has an active community that helps.
Cons: worries about being locked into a vendor, limits on data retention policies, less control over infrastructure, a learning curve for advanced features, and possibly high costs when dealing with large amounts of data.
How do you pick the best tool for monitoring performance?
Before you go for the tool or you have still some questions about performance monitoring ,you can read more about it on our comprehensive guide on performance monitoring for more insights.
What Should You Think About When It Comes to System Requirements?
Your monitoring tool needs are based on an assessment of the scale and complexity. Big, complicated IT systems need tools that can handle a lot of data quickly and easily. Basic monitoring solutions work well in simple environments.
Think about the architecture of your current system, the patterns of traffic, and the growth projections. Multi-service environments need full monitoring capabilities.
What do you need to keep an eye on?
Set monitoring needs before choosing tools. Find out if you need alerts in real time, analysis of past data, or detailed performance metrics. Different tools are better at keeping an eye on different things.
Think about how much detail is needed, how alerts should work, and how long data should be kept. Monitoring user experience may need different tools than monitoring infrastructure.
How Important Are Compatibility and Integration?
Integration capabilities have a big effect on how well a tool works. Pick solutions that work well with the infrastructure and development tools you already have. Compatibility makes it easier to put things into place and keep them up to date.
Check out the current technology stack, the development workflows, and the needs of third-party services. API compatibility makes sure that data flows smoothly between systems.
What budget limits are affecting your choice?
Budget considerations include everything from open-source software to enterprise solutions. Find out the total cost, which includes licensing, implementation, training, and regular maintenance. Setting up and managing free tools may require more internal resources.
Think about the long-term costs as your business grows. Volume-based pricing can go up a lot as the business grows.
How hard should it be to set up and manage?
Ease of deployment has an effect on how productive a team is and how well they adopt something. Pick tools that fit your team's level of technical knowledge and the time they have to set them up. For complicated solutions, you might need to get special training or hire outside help.
Think about how much maintenance will be needed, how hard the user interface is to use, and how good the documentation is.
What makes performance monitoring tools necessary for modern apps?
Why Do People Think These Tools Are Digital Superheroes?
Performance monitoring tools act like digital guardians, making sure that systems are reliable and that users have a good experience. These solutions offer in-depth analytics, strong security features, and a wide range of service integrations. Companies get the information they need to make smart choices and improve system performance.
To stay ahead of the competition, modern applications need to be watched all the time. Performance problems have a direct effect on how happy users are and how much money a business makes.
How do monitoring tools keep systems from having problems?
Proactive issue detection stops small problems from turning into big outages. Monitoring tools find patterns of performance decline before users have problems. This early warning system keeps services reliable and cuts down on downtime.
When problems happen, the ability to quickly fix them lessens their effect on the business. Automated alerts let you respond right away to important situations.
What Part Do These Tools Play in the Digital Transformation?
To achieve digital excellence, organizations need to be able to monitor performance reliably as they work to give users the best possible experience. In digital landscapes that change quickly, reliable monitoring tools help people succeed. Full monitoring capabilities help businesses grow and keep customers happy.
Tools for monitoring performance that can be used in many ways are the best for organizations. Knowing what you need helps you choose the right tools.
Questions People Frequently Ask About Tools for Monitoring Performance
What is the price of performance monitoring tools?
The costs of performance monitoring tools can be very different depending on their features, size, and how they are used. Prometheus and other open-source solutions are free, but you need to know how to set them up and keep them running. DataDog and New Relic are examples of cloud-based platforms that charge $15 to $50 per host per month, with enterprise features costing more. Zipy.ai has competitive prices, starting with a free tier that lasts forever for basic monitoring needs.
Depending on how many features you need and how much data you have, enterprise solutions like Dynatrace and AppDynamics can cost $50 to $200 or more per host per month. When making a budget, think about the total cost of ownership, which includes setup, training, and ongoing maintenance. A lot of vendors let you try out their products for free or at a lower price before you buy them.
What is the difference between performance monitoring tools and APM?
Application Performance Monitoring (APM) looks only at metrics at the application level, the user experience, and code-level diagnostics. Performance monitoring tools include monitoring of servers, networks, databases, and system resources as part of a larger infrastructure monitoring effort. New Relic and AppDynamics are two examples of APM tools that are great at keeping track of user transactions and application bottlenecks.
APM features are often included in performance monitoring tools along with infrastructure monitoring features. Modern solutions make these differences less clear by providing full observability platforms. Pick APM-focused tools if you only need to monitor applications, or full-stack visibility platforms if you need to see everything. To get full coverage, many businesses use both specialized APM tools and more general performance monitoring tools.
How do tools for monitoring performance find problems before they happen?
Performance monitoring tools find possible problems early by using predictive analytics, machine learning algorithms, and alerts that are based on thresholds. These tools set baseline performance patterns and find problems that show things are getting worse. AI-powered platforms like Dynatrace automatically link metrics from different systems to find problems before they happen.
Advanced monitoring tools look at patterns in response times, error rates, resource use, and user behavior to find problems. Automated alerts let IT teams know right away when metrics go outside of normal ranges or get close to critical levels. Predictive capabilities help teams deal with memory leaks, performance bottlenecks, and capacity limits before they affect users or cause system outages.
Do performance monitoring tools work with cloud-native apps and microservices?
Modern performance monitoring tools are made to work with microservices architectures and cloud-native environments. DataDog, New Relic, and Dynatrace are some of the best tools for keeping an eye on containerized apps, Kubernetes clusters, and distributed systems. These platforms let you monitor service meshes, trace things across a network, and find new services automatically in dynamic environments.
Cloud-native monitoring tools automatically change to fit applications that grow and infrastructure that doesn't last long. They keep an eye on communications between services, API calls, and dependencies in complicated microservices architectures. People really like using Prometheus with Grafana to monitor Kubernetes because it was made for the cloud and can connect to a lot of other systems.
Which tool for monitoring performance should startups use?
Startups should look for monitoring solutions that are cheap, easy to set up, and grow with the business. Zipy.ai is a great deal because it has a free tier that lasts forever and focuses on frontend monitoring and user experience. LogRocket has useful session replay features that help you fix problems that users report. Prometheus and Grafana together give technical teams a powerful way to monitor open source software.
Look for tools that have clear prices, are easy to set up, and have a lot of community support. Stay away from enterprise solutions that are too complicated and need a lot of time and money to set up and maintain. Begin with basic monitoring needs and move up to more advanced platforms as your team and infrastructure grow. A lot of successful startups start out with basic tools and then move on to more advanced ones.


.webp)