.svg)


What do Zipy's personalized alerts do?
Zipy Custom Alerts are smart, real-time triggers that let engineering teams know when an application has encountered an error. Session Replays are attached right away so they can quickly figure out what went wrong. Zipy is different from other log monitoring tools because it doesn't just tell you what went wrong; it also tells you why it went wrong.
When teams have to choose between basic logging and advanced observability, this feature changes how they respond to incidents. Zipy shows a visual replay of the user's path leading up to the crash, so you don't have to look through server logs by hand. This blog shows you how to set up these alerts so that you don't have to do reactive debugging. Instead, you can set up a proactive, user-centred monitoring plan that cuts Mean Time to Resolution (MTTR) in half.
Why Real-Time Alerting Is Important
Data shows that the longer a bug stays in production, the more it costs to fix. It can actually cost many times more to fix it than when it had been found during development or right after it came out. Zipy's Custom Alerts help reduce this risk by acting as an automatic guardrail that finds problems right away.
- Gets in touch with the right teams: Sends alerts to specific channels, like DevOps, QA, or Frontend leaders.
- Increases speed of finding the root cause: Adds the Session Replay to the alert so you don't have to go looking in different places.
The most important parts of Zipy Custom Alerts
- Flexible Conditions for Triggering: Set up alerts based on the number and type of errors.
- Filters with a lot of detail: To avoid alert fatigue, filter for certain environments (like Staging vs. Production), browsers, operating systems, or groups of users.
- Integrations that work well: You can send notifications directly to where your team works, such as Slack, Microsoft Teams, Email, or custom Webhooks.
- Notifications with a lot of information: The "session context" in Zipy alerts shows you the user's path to the error, which is what makes them different from regular log alerts.
Note: With Zipy's granular filtering, you can make sure that your team only works when there are real problems that affect the user experience, not just temporary network problems.
Prerequisites:
You need to make sure that your workspace infrastructure is ready before you set your logic rules. Events are what custom alerts are based on.
Before you try to make your first alert, make sure you meet these five technical requirements:
1. Zipy SDK: Make sure you have the Zipy SDK installed in your web app.
2. Check the amount of traffic you get: You must have some amount of traffic coming to your application for the alerts to fire.
3. Integrations: Connect all of important integrations like Microsoft Teams, Slack, Jira, etc to custom alerts.
4. Permissions: Make sure your account has access to setting up and running the Custom Alerts feature.
Step by Step Guide to make the perfect Custom Alerts
You can't just fill up boxes in Zipy to make an alert. You also need to make a logic flow that gets rid of noise and brings important signals to the top. This is how to set up an alert that your team will really believe.
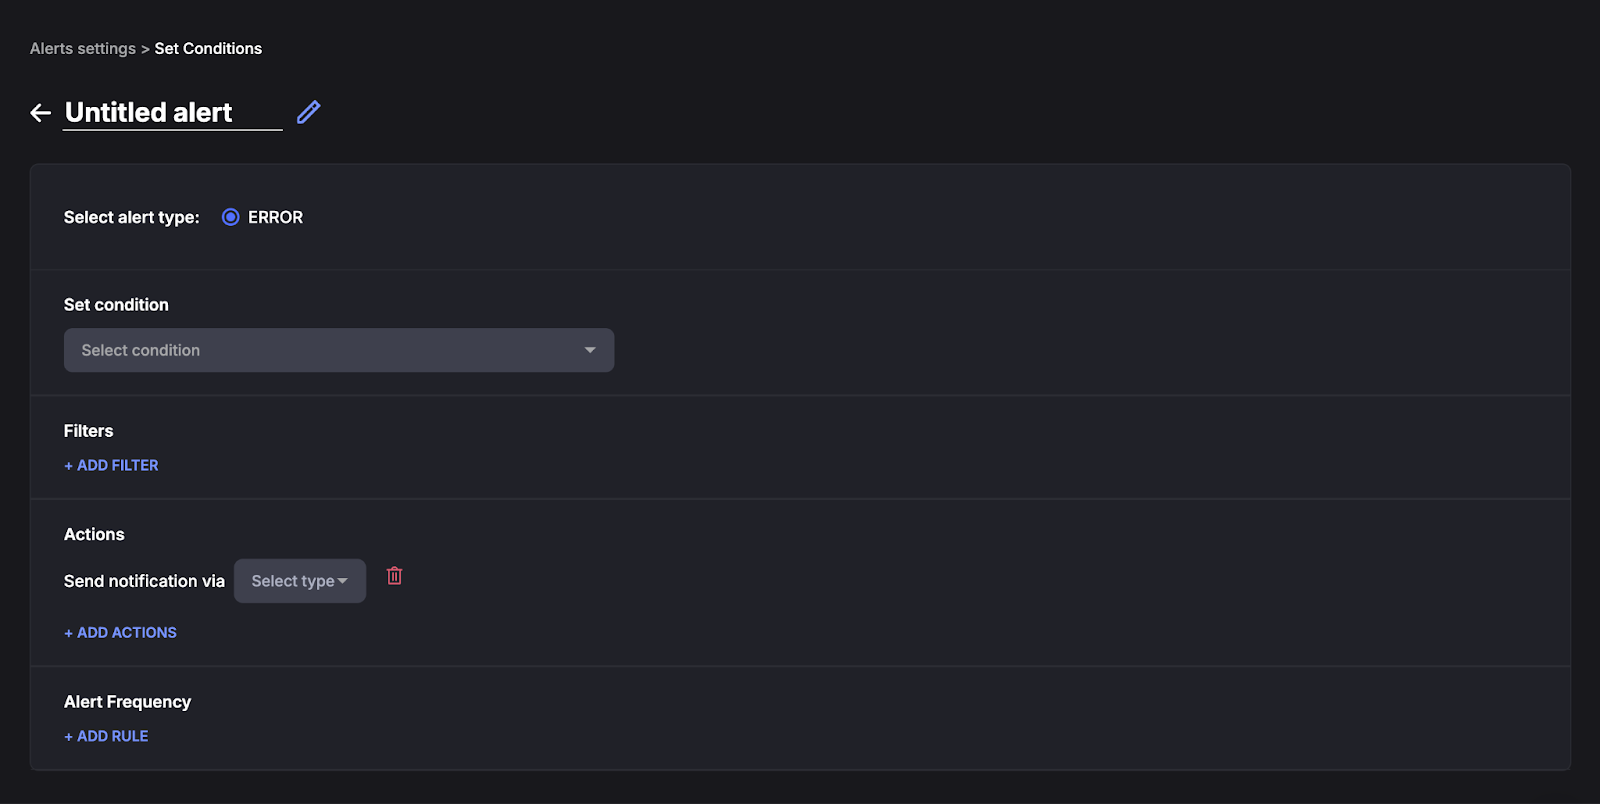
Step 1: Name the Alert Clearly
The first step to see something is to organise it. Use a structured naming system that has the Service, Error Type, and Environment in it. This makes it easier to search and filter notifications as your library grows.
Step 2: Set Conditions
This feature lets the users comprehensively monitor and handle errors. Conditions are also perfect for real time analysis.

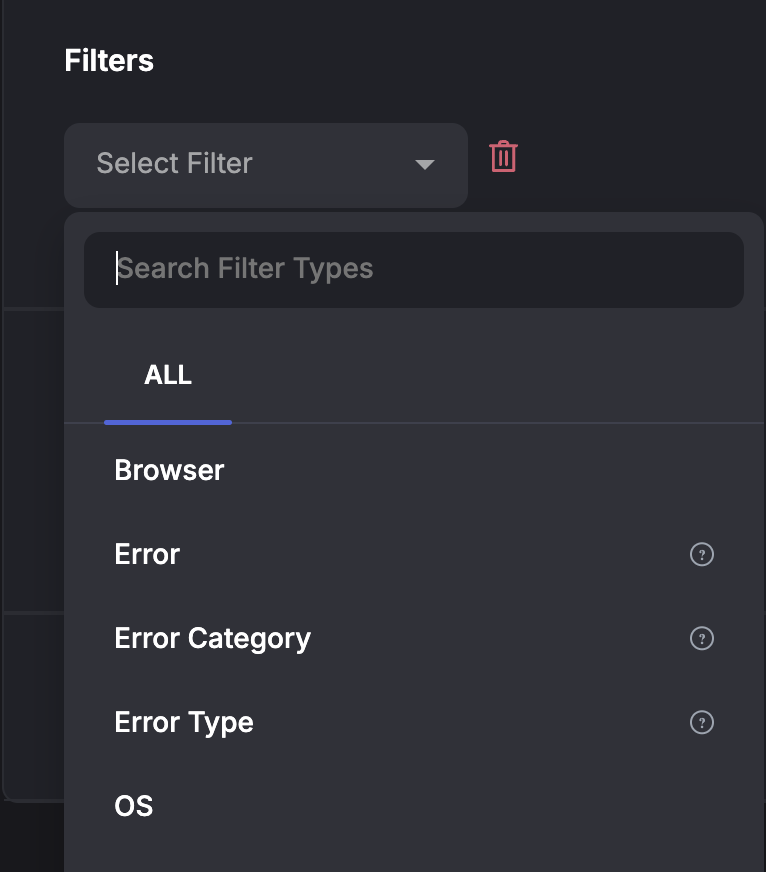
Step 3: Use Filters
Filter types help you pinpoint error detection based on OS, error type, category, release version, etc.
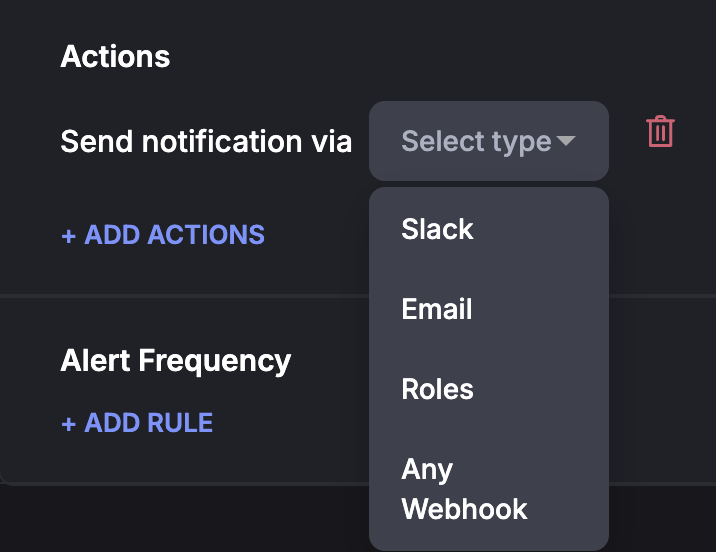
Step 4: Set up Actions
Click on "ADD ACTIONS" to choose where the signal goes.
Alerts that are important: Send it to PagerDuty or a high-priority Slack channel, such as #devops-incidents.
Not Critical/Warning: Send to a digest email or a Slack channel with low priority, like #frontend-bugs.
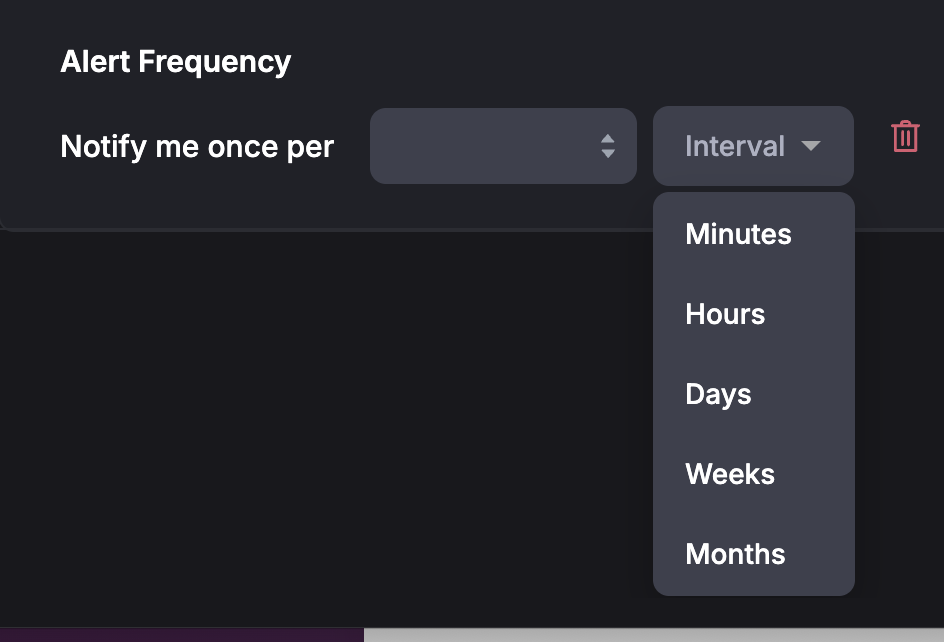
Step 5: Alert Frequency
You can set up the Alert frequency for your errors. Major errors can be allocated with recurring alerts and Minor errors can be allocated with fewer alerts.
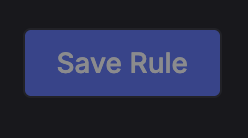
Step 6: Save The Rules
After doing all the above steps, you can save these rules. Now you can test out your brand new Alert.
The Incident Response Workflow: From Alert to Fix
Not only do Custom Alerts let you know when something is wrong, but they also give you the forensic evidence you need to figure out why. Using Zipy at work changes the way you debug from a "guessing game" to a more accurate method.
This is how Zipy Custom Alerts help engineering teams lower their Mean Time to Resolution (MTTR):
1. Immediate Detection
The alert goes straight to your chosen channel (Slack, Email, PagerDuty) as soon as a threshold is crossed (for example, "5 users got a 500 error in 10 minutes").
The Old Way: Waiting for a bad review on Twitter or a ticket to get help.
The Zipy Way: You find out about the problem before the customer leaves the site.
Result: "Time to Detect" drops a lot.
2. Contextual Visualisation
You don't have to figure out what the strange text logs mean. Just open the alert and click on the link for Session Replay.
This takes you straight to the user's screen. You can see:
Visual Proof: What the user did right before the crash, like clicking, scrolling, or typing.
Technical State: The Console Logs, Network Requests, and Stack Traces that were synced to that exact time.
3. Quick Triage and Analysis of Effects
Because the alert pulls data from many users, you can quickly find out the root cause of the problem using the dashboard filters.
Is there a problem with the system? (Does this happen to everyone?)
Is it because of the setting? (Only happening on iOS Safari?)
Does it have a time limit? (Was it right after the v2.4 deployment?)
Outcome: Making choices right away. You can tell right away if this needs a regular ticket, a Hotfix, or a Rollback.
4. Root Cause Analysis (RCA)
While you're in the session, you can find the code failure without asking the user for screenshots.
Look at Network Calls: To see if an API sent back invalid JSON, look at the actual request and response payloads.
Check out the Stack Traces: Right-click on the line of code that is causing the JS error.
Check out DOM Events: Make sure that a certain set of missclicks didn't cause a race condition on the front end.
Result: Fewer loops to fix. Engineers go straight to the broken code.
5. Continuous Tuning
A living system is a way to alert. As your product changes, use what you learnt from these events to make your guardrails better:
Make the Filters Tighter: If an alert was too loud, add more specific filters to it. For example, don't include "Internet Disconnected" problems.
Change the thresholds: If you missed a big bug, lower the number of users who can see it.
Notifications that are split: Create separate alerts for "Critical Payments" and "Cosmetic UI Bugs."
Outcome: A strong, low-noise culture of observability that protects important user flows.
Frequently Asked Questions (FAQ)
1. What sets Zipy Custom Alerts apart from regular error logging?
Standard error logging tools give you stack traces in text form that show what went wrong on the server. The "session context" feature of Zipy Custom Alerts makes them stand out. This is a visual replay of the user's screen, console logs, and network interactions. This shows the user exactly how and why the mistake happened.
2. Can you filter Zipy notifications to get rid of false alarms and noise?
Yes. You won't get tired of alerts with Zipy because you can filter them in many different ways. You can set up alerts to go off only when a certain number of users are affected (thresholds), or you can filter them by things like the environment (production vs. staging), browser, OS, URL route, or certain types of errors.
3. What kinds of integrations does Zipy support for sending alerts?
Zipy works directly with the tools that engineers use on a daily basis. You can send alerts to Slack and Microsoft Teams so that everyone knows, or you can use Webhooks to connect with incident management tools like PagerDuty and Opsgenie for more serious escalation.
4. Does Zipy help make sure that a bug fix works?
Yes. Zipy Custom Alerts are always watching. The alert stays on even after the repair is made. The fix is confirmed if the alert stops going off. Zipy will let you know right away if it goes off again that a regression or a fix that didn't work has happened.


.webp)